Fig. 3

Download original image
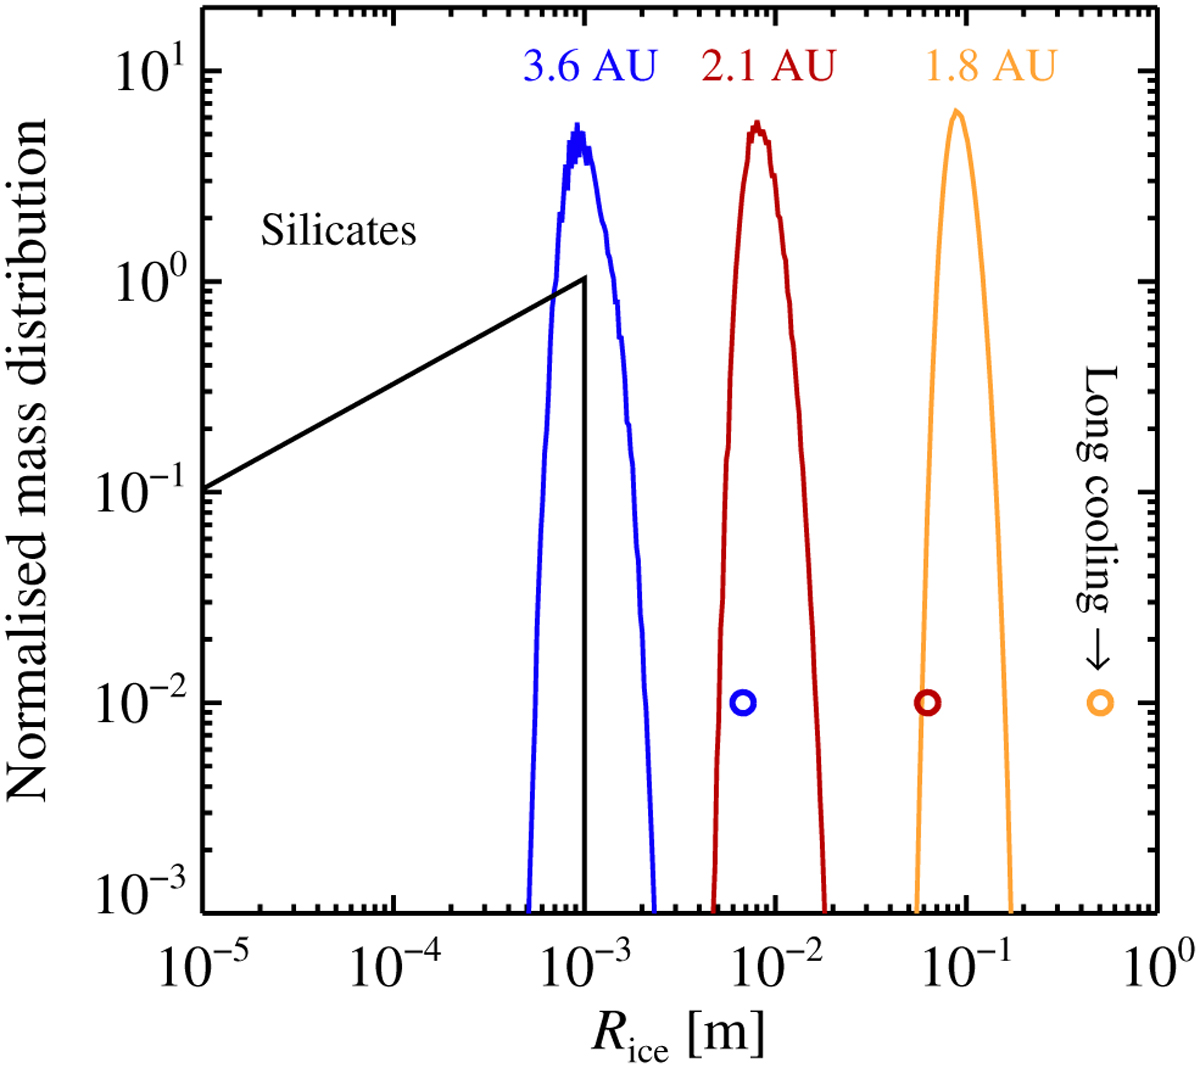
Mass distribution of particles (normalised such that the integral over the logarithmic radius is always unity) just outside of the ice line at 1.8 (yellow line), 2.1 (red line), and 3.6 au (blue line) after the ice line has returned to its quiescent state in a scenario with a cooling time of tcool = 100 yr. We indicate the particle size for the longer cooling time of 1000 yr with circles. The black line shows the mass distribution of bare silicate particles.
Current usage metrics show cumulative count of Article Views (full-text article views including HTML views, PDF and ePub downloads, according to the available data) and Abstracts Views on Vision4Press platform.
Data correspond to usage on the plateform after 2015. The current usage metrics is available 48-96 hours after online publication and is updated daily on week days.
Initial download of the metrics may take a while.


