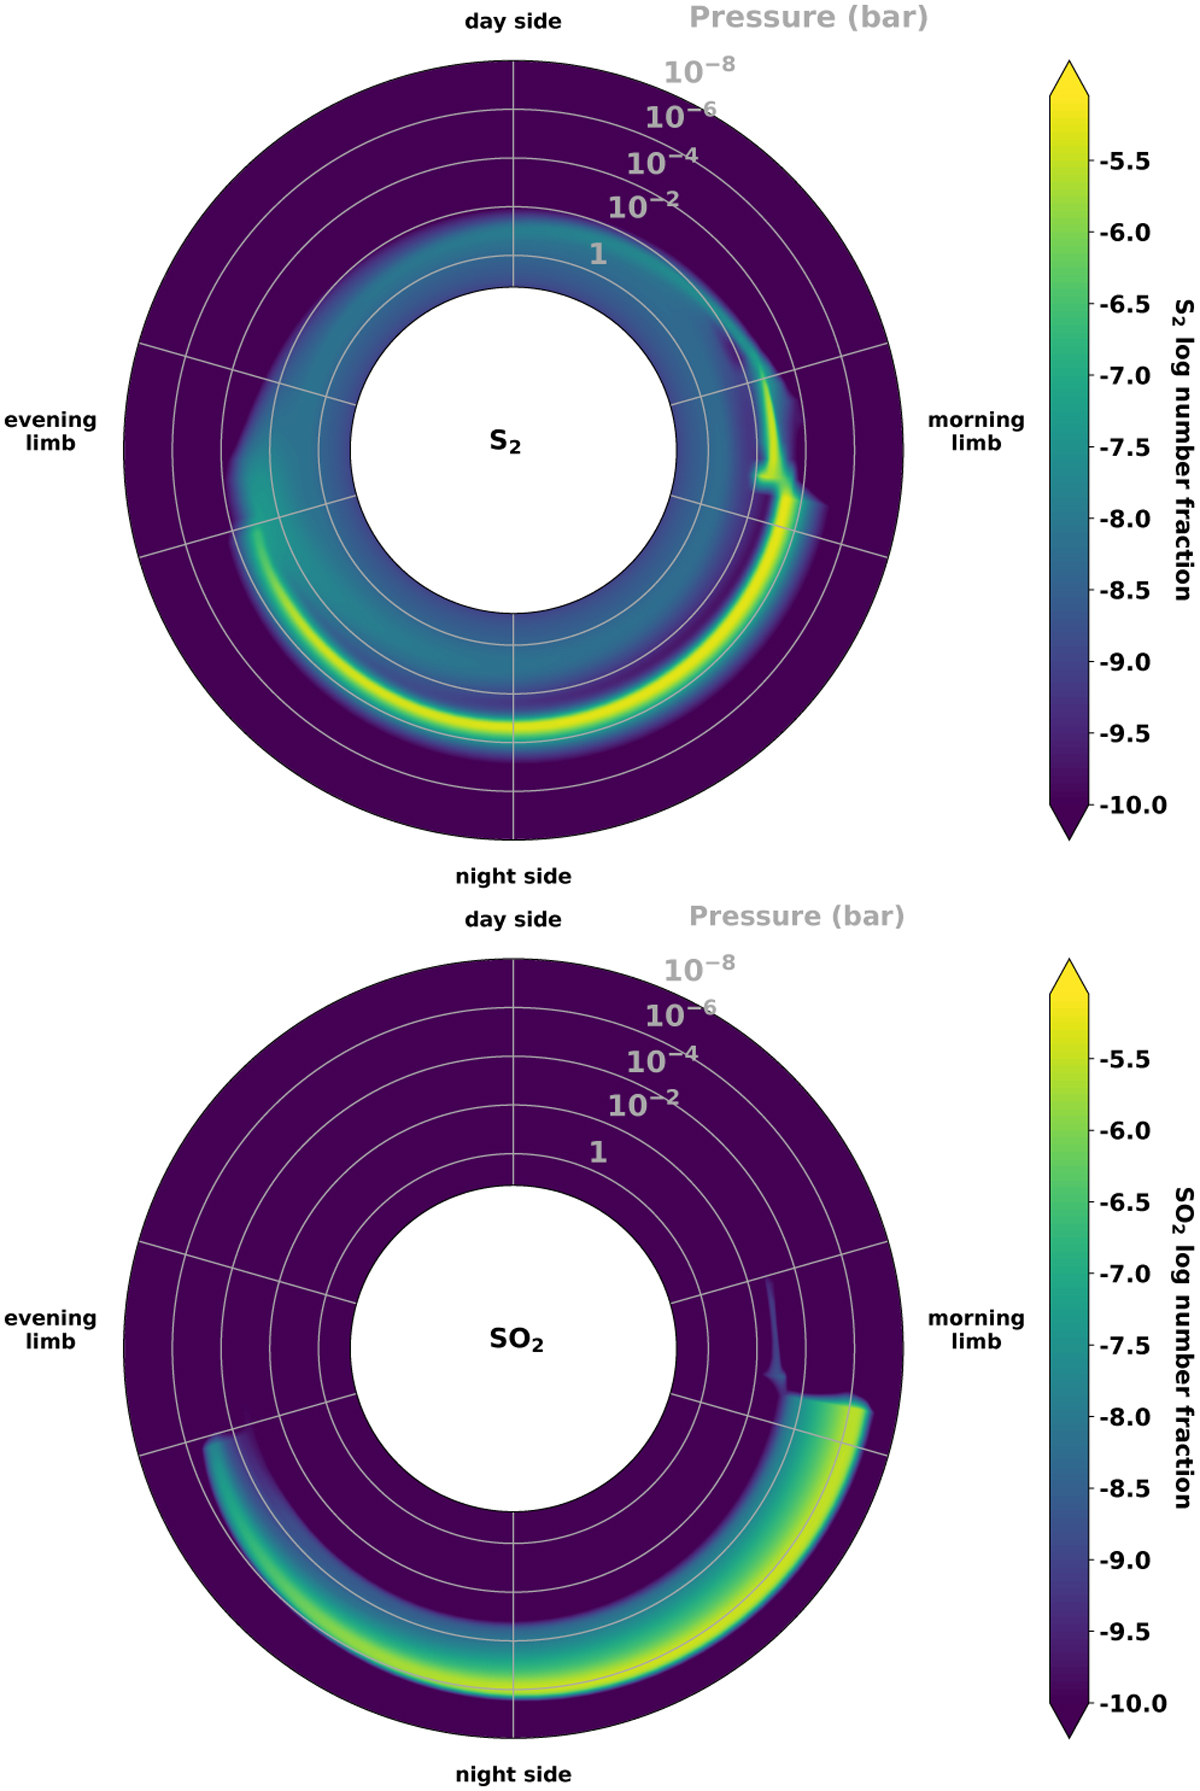
Fig. 6
Download original image
Polar plots of the S2 and SO2 abundances in WASP-76 b, computed using the C–H–N–O–S chemical network of Tsai et al. (2021b) in our pseudo-2D kinetics code. An equatorial slice of the planet is displayed, with radial lines at the limbs indicating the opening angle (32°). Enhancements similar to HCN (Fig. 3) can be seen on the night side.
Current usage metrics show cumulative count of Article Views (full-text article views including HTML views, PDF and ePub downloads, according to the available data) and Abstracts Views on Vision4Press platform.
Data correspond to usage on the plateform after 2015. The current usage metrics is available 48-96 hours after online publication and is updated daily on week days.
Initial download of the metrics may take a while.