Fig. 1
Download original image
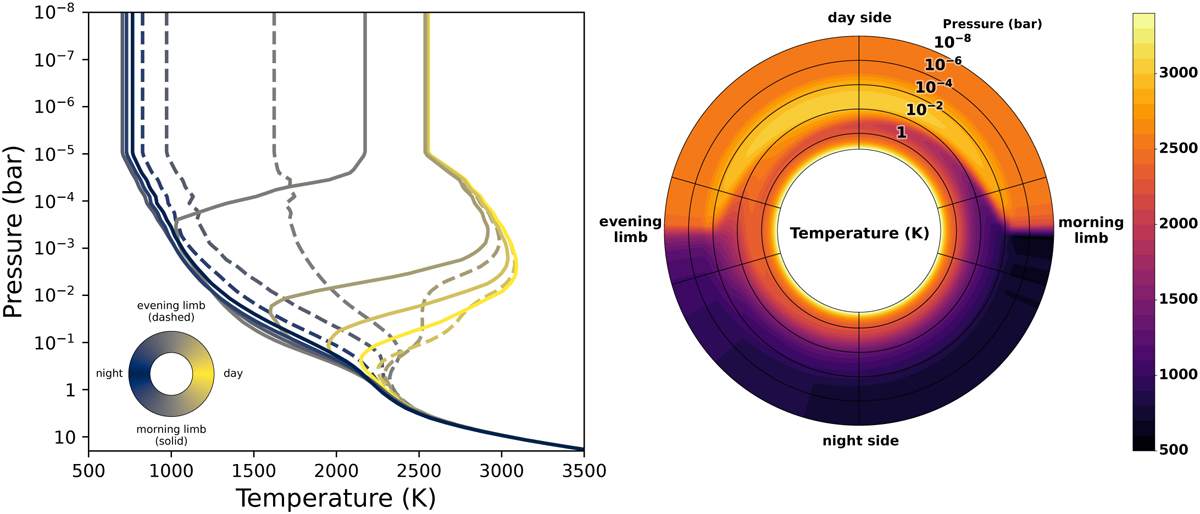
Temperature plots for the WASP-76 b simulation (Schneider et al. 2022b) computed using the expeRT/MITgcm (Carone et al. 2020; Schneider et al. 2022c). Left: pressure–temperature profiles plotted at different longitudes on the planetary equator. Solid and dashed lines correspond to longitudes respectively eastwards and westwards of the substellar point. An isothermal upper atmosphere is assumed for pressures p < 10−5 bar. Right: temperature map as equatorial slice, plotted as a function of longitude and pressure. At the evening and morning limbs, radial lines indicate the opening angle that is probed during transit (32°), using the method of Wardenier et al. (2022).
Current usage metrics show cumulative count of Article Views (full-text article views including HTML views, PDF and ePub downloads, according to the available data) and Abstracts Views on Vision4Press platform.
Data correspond to usage on the plateform after 2015. The current usage metrics is available 48-96 hours after online publication and is updated daily on week days.
Initial download of the metrics may take a while.