Fig. 9
Download original image
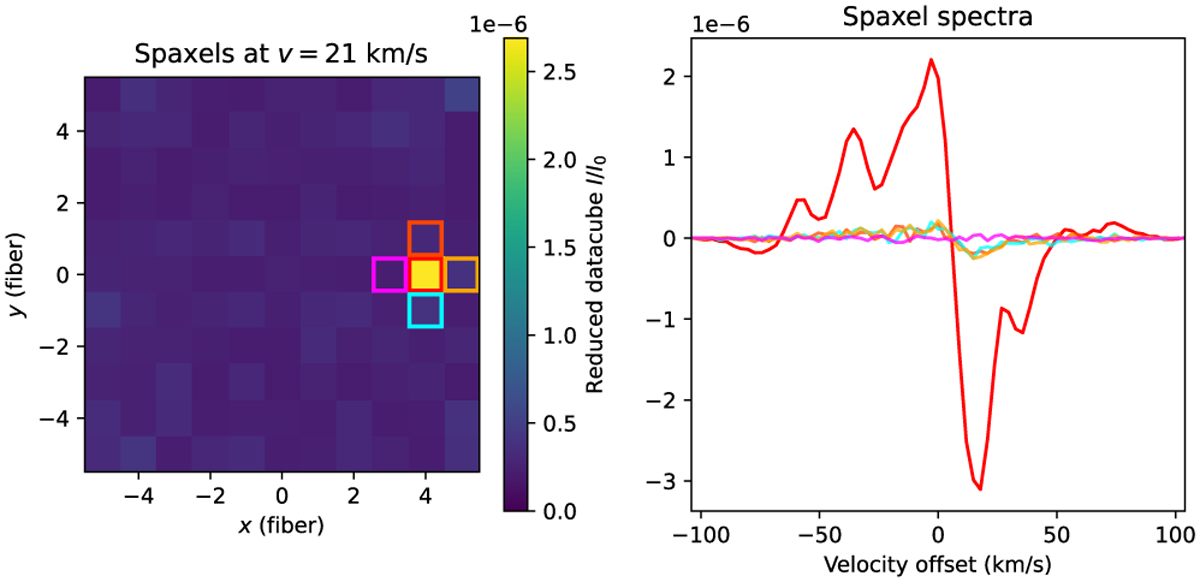
Example reduced data cube with a 10−6 planet with its own emission spectrum located at the (4, 0) fiber. The image is scaled to the maximum intensity in the cube before data reduction. The left panel shows the absolute signal per fiber at a velocity offset of 21 km s−1. The right shows the spectra of several spaxels around the simulated planet signal, with the corresponding spaxels colored in the left panel. This data cube was reduced without the addition of detector noise but with the addition of photon noise and a closed-loop AO simulation.
Current usage metrics show cumulative count of Article Views (full-text article views including HTML views, PDF and ePub downloads, according to the available data) and Abstracts Views on Vision4Press platform.
Data correspond to usage on the plateform after 2015. The current usage metrics is available 48-96 hours after online publication and is updated daily on week days.
Initial download of the metrics may take a while.