Fig. 8
Download original image
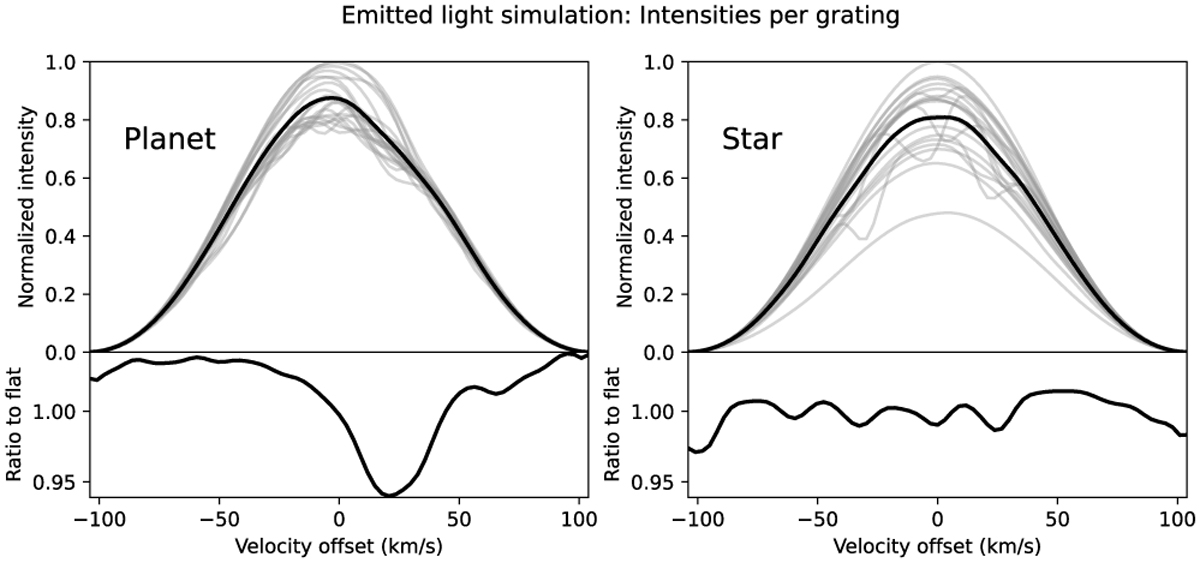
Simulated detector intensities for the planet and star for a single fiber containing the Airy core of the respective source. In the top panels, the gray lines show the results for each of the 20 individual Bragg gratings, with the black line showing the total response of the multiplexed Bragg grating, which is the sum of all gratings. The large, Gaussian-shaped intensity profile is due to the wavelength-dependent transmission of the grating. In the bottom panels we show the ratio between these total responses and the response to a flat input spectrum as a measure of the average spectrum seen by the instrument.
Current usage metrics show cumulative count of Article Views (full-text article views including HTML views, PDF and ePub downloads, according to the available data) and Abstracts Views on Vision4Press platform.
Data correspond to usage on the plateform after 2015. The current usage metrics is available 48-96 hours after online publication and is updated daily on week days.
Initial download of the metrics may take a while.