Fig. 6

Download original image
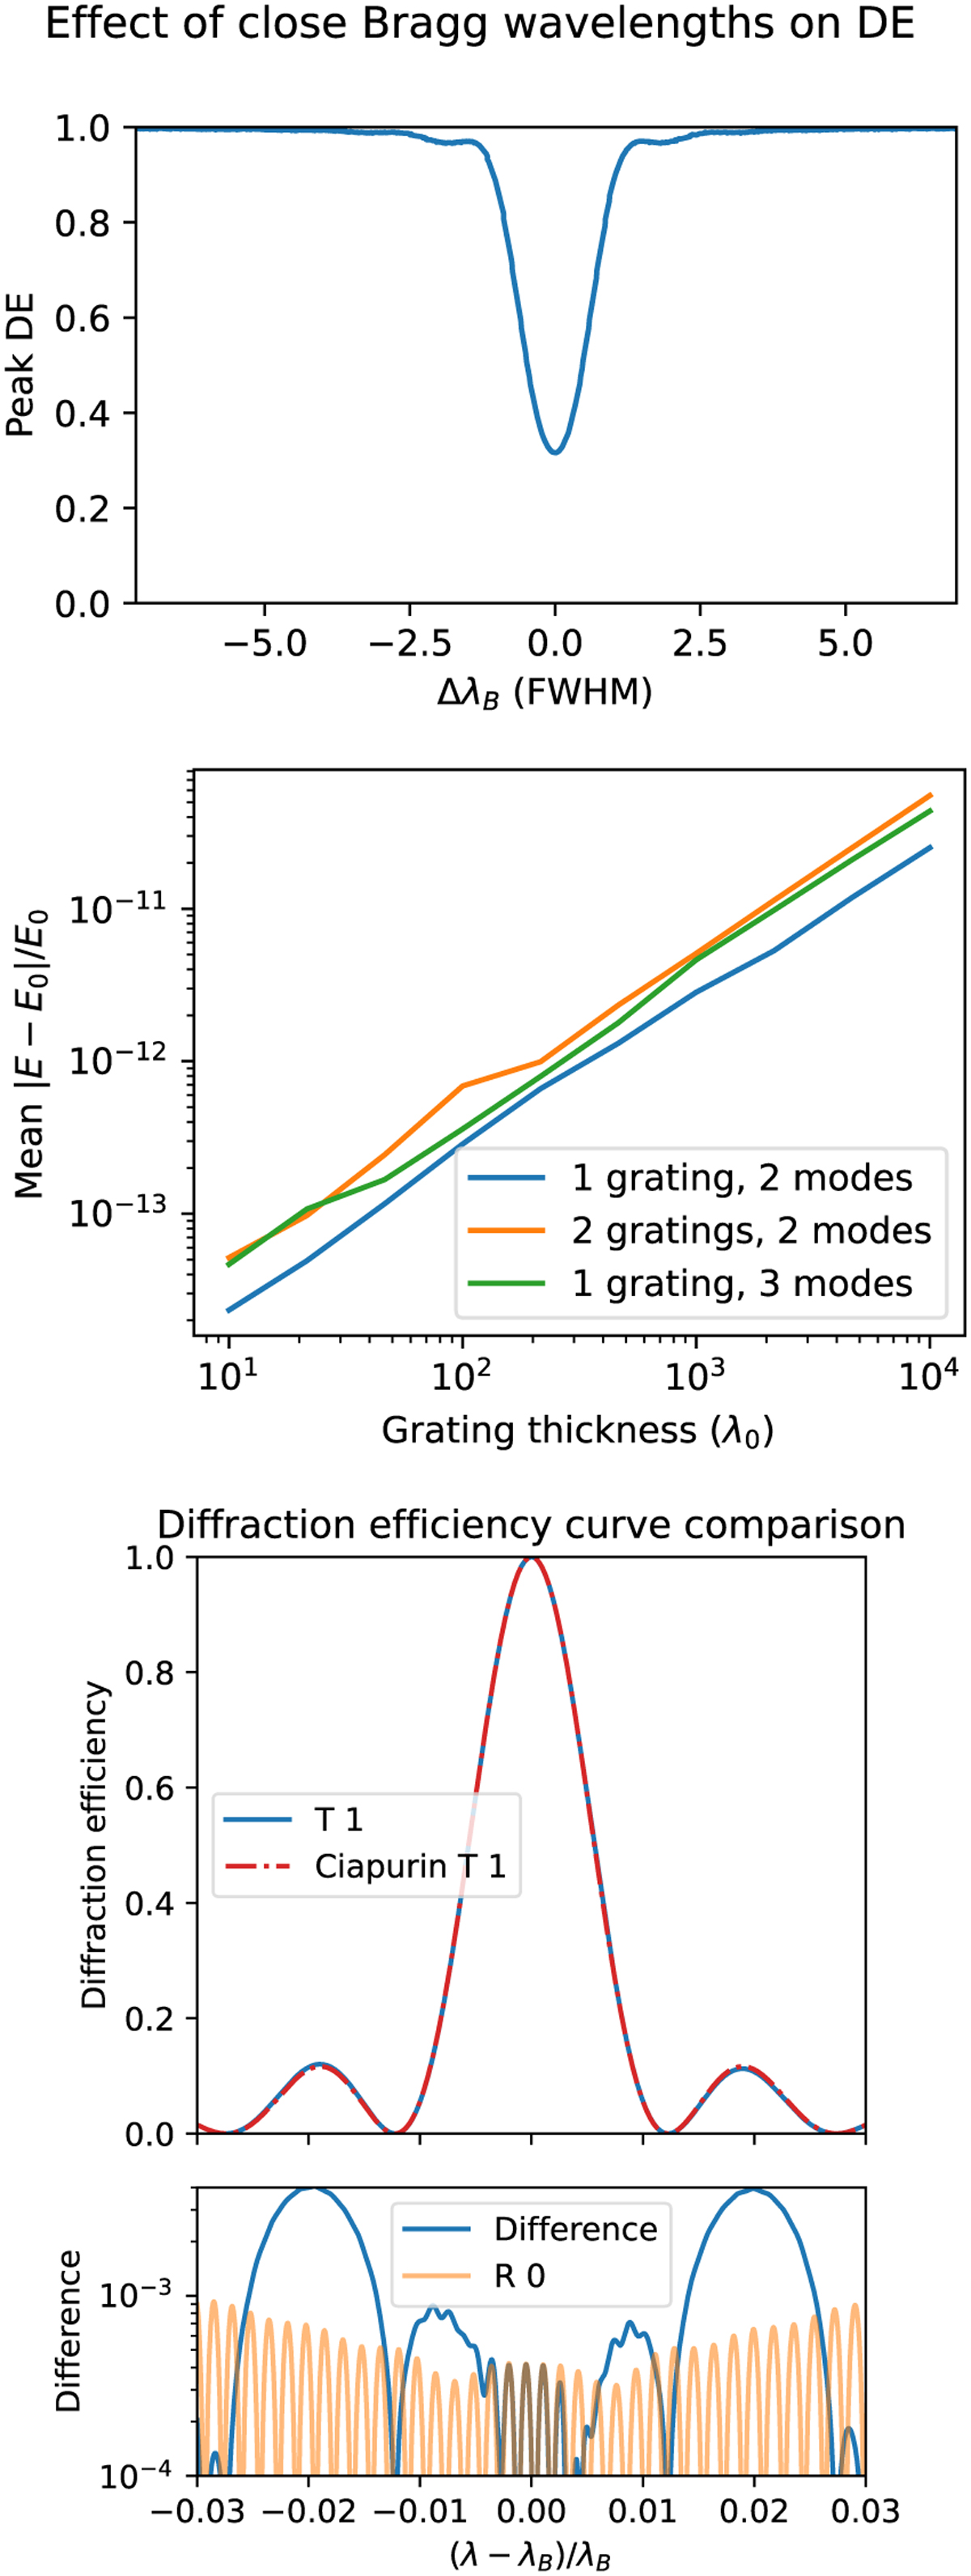
Three simulations for code verification. The first panel shows how the peak diffraction efficiency of two gratings changes as a function of the difference in their central wavelengths. The difference in central wavelength is measured in terms of the FWHM of a diffraction efficiency curve. The second simulation shows energy nonconserva-tion through a slab of material containing one or two Bragg grating(s), with the [0, 1(, 2)] modes used. Any energy nonconservation here stems from numerical errors. The third panel shows the comparison between a diffraction efficiency curve from our RCWA code and an analytically derived diffraction efficiency curve from Ciapurin et al. (2005). The top plot shows the first transmitted order, and the bottom plot shows the difference of the two curves in the top plot and the zeroth reflected order. The differences between our result and Ciapurin et al. (2005) are at or below the level of ~1%.
Current usage metrics show cumulative count of Article Views (full-text article views including HTML views, PDF and ePub downloads, according to the available data) and Abstracts Views on Vision4Press platform.
Data correspond to usage on the plateform after 2015. The current usage metrics is available 48-96 hours after online publication and is updated daily on week days.
Initial download of the metrics may take a while.


