Fig. 5
Download original image
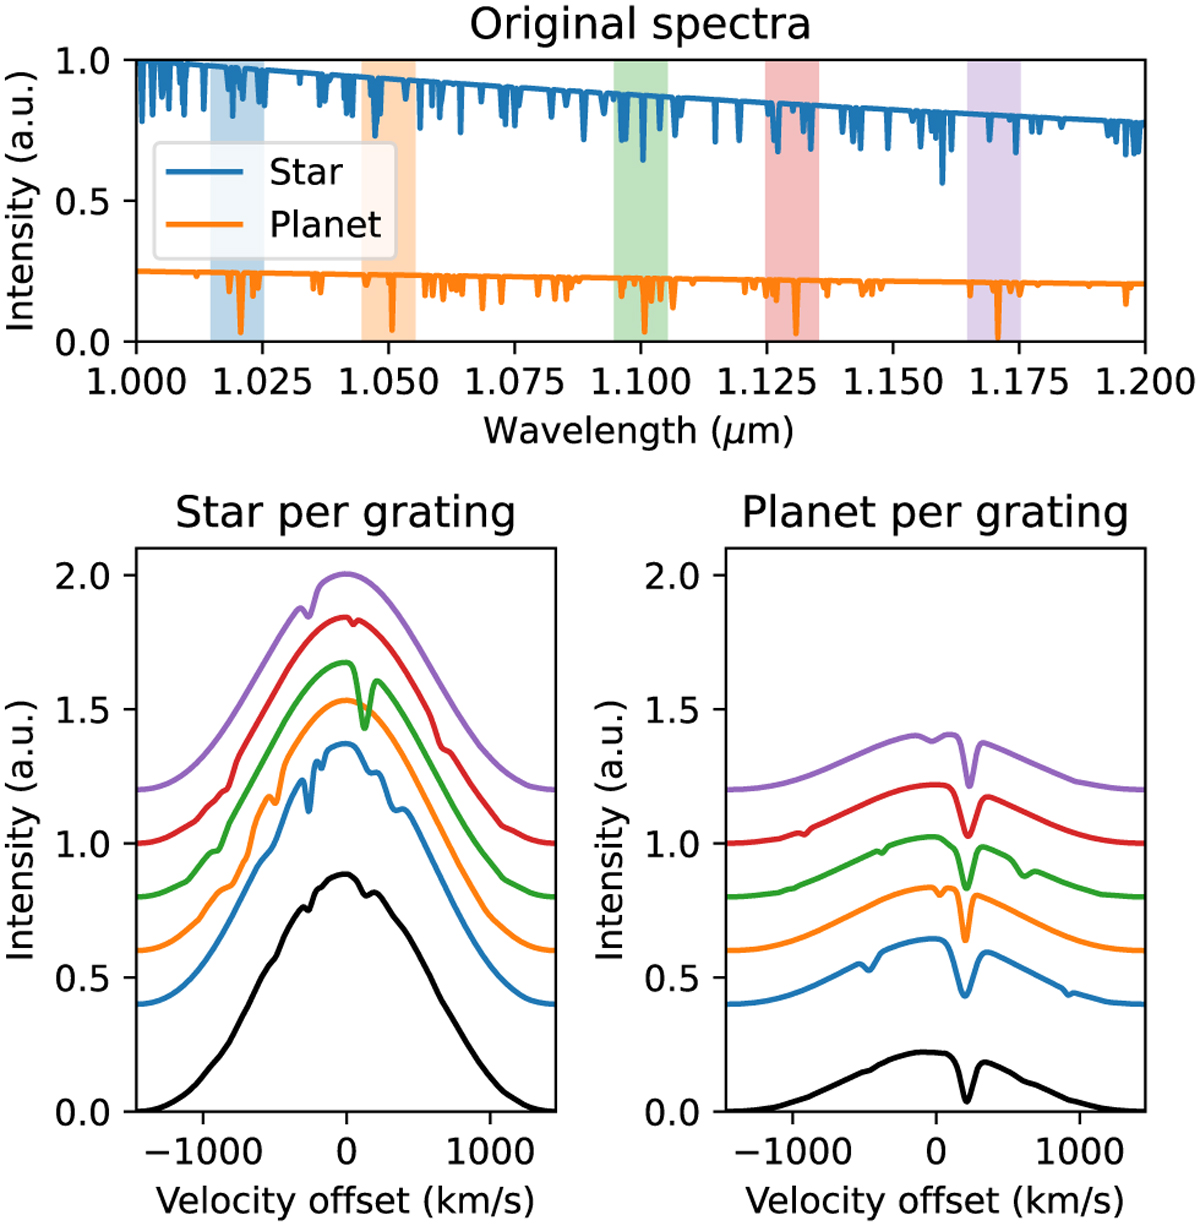
Passbands for example spectra and the process and result of multiplexing several Bragg gratings. The top panel shows two example spectra, one for a planet that contains spectral features we wish to extract and one for a star whose spectral features we want to ignore. The colored bands represent the passbands of five multiplexed Bragg gratings, each chosen to have a Bragg wavelength around a planetary spectral feature. The colors of each band correspond to the line colors in the lower plots, which show the spectra after individual gratings for the star and planet separately, with an offset between the lines for clarity. The individual spectra are plotted as a function of velocity offset that is proportional to the wavelength. The black spectra are the total signals, which have been optically stacked (effectively summed) due to the multiplexed gratings. The stellar spectral features are different for every grating; the optically combined stellar spectrum therefore becomes smoother as more and more gratings are used. On the other hand, the planet has its spectral features of interest aligned due to the choice of Bragg wavelengths, leading to a prominent overall spectral feature. Figure based on Fig. 4 from Haffert et al. (2019b).
Current usage metrics show cumulative count of Article Views (full-text article views including HTML views, PDF and ePub downloads, according to the available data) and Abstracts Views on Vision4Press platform.
Data correspond to usage on the plateform after 2015. The current usage metrics is available 48-96 hours after online publication and is updated daily on week days.
Initial download of the metrics may take a while.