Fig. 3
Download original image
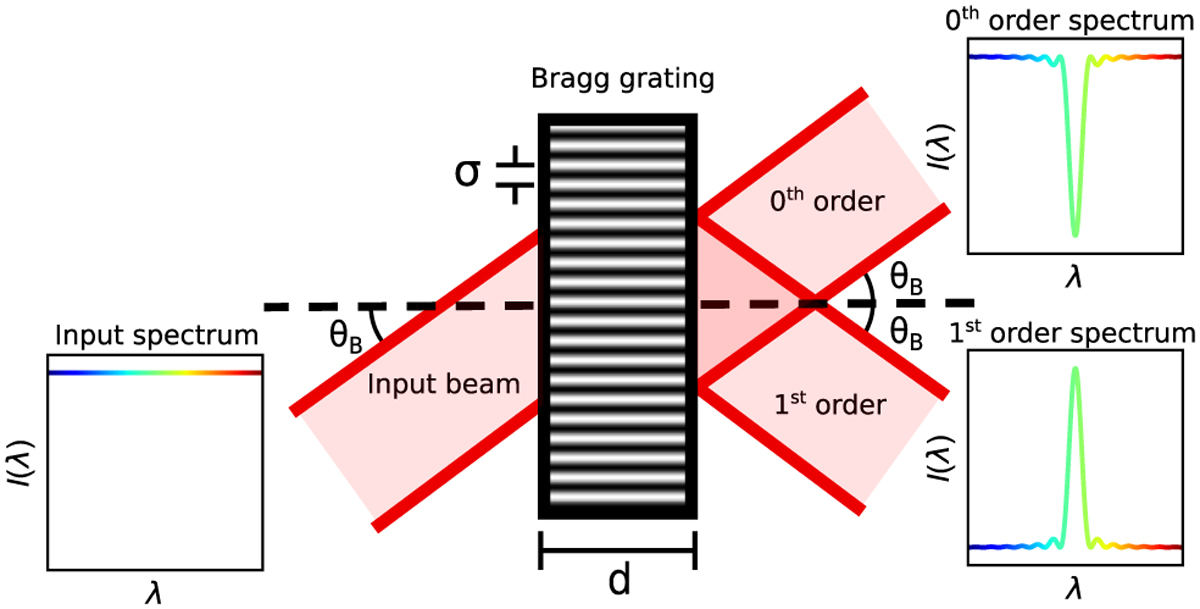
Schematic top-down view of a Bragg grating as an optical component and its effect on a beam. A collimated input beam with a flat spectrum enters the Bragg grating from the left. The grating diffracts the beam into the zeroth and first orders transmission orders. Inside the Bragg grating the refractive index modulation is visualized by the black and white stripes. The Bragg angle θB, grating thickness d, and grating pitch σ are also visualized. Based on Fig. 2 from Haffert et al. (2019b).
Current usage metrics show cumulative count of Article Views (full-text article views including HTML views, PDF and ePub downloads, according to the available data) and Abstracts Views on Vision4Press platform.
Data correspond to usage on the plateform after 2015. The current usage metrics is available 48-96 hours after online publication and is updated daily on week days.
Initial download of the metrics may take a while.