Fig. 2
Download original image
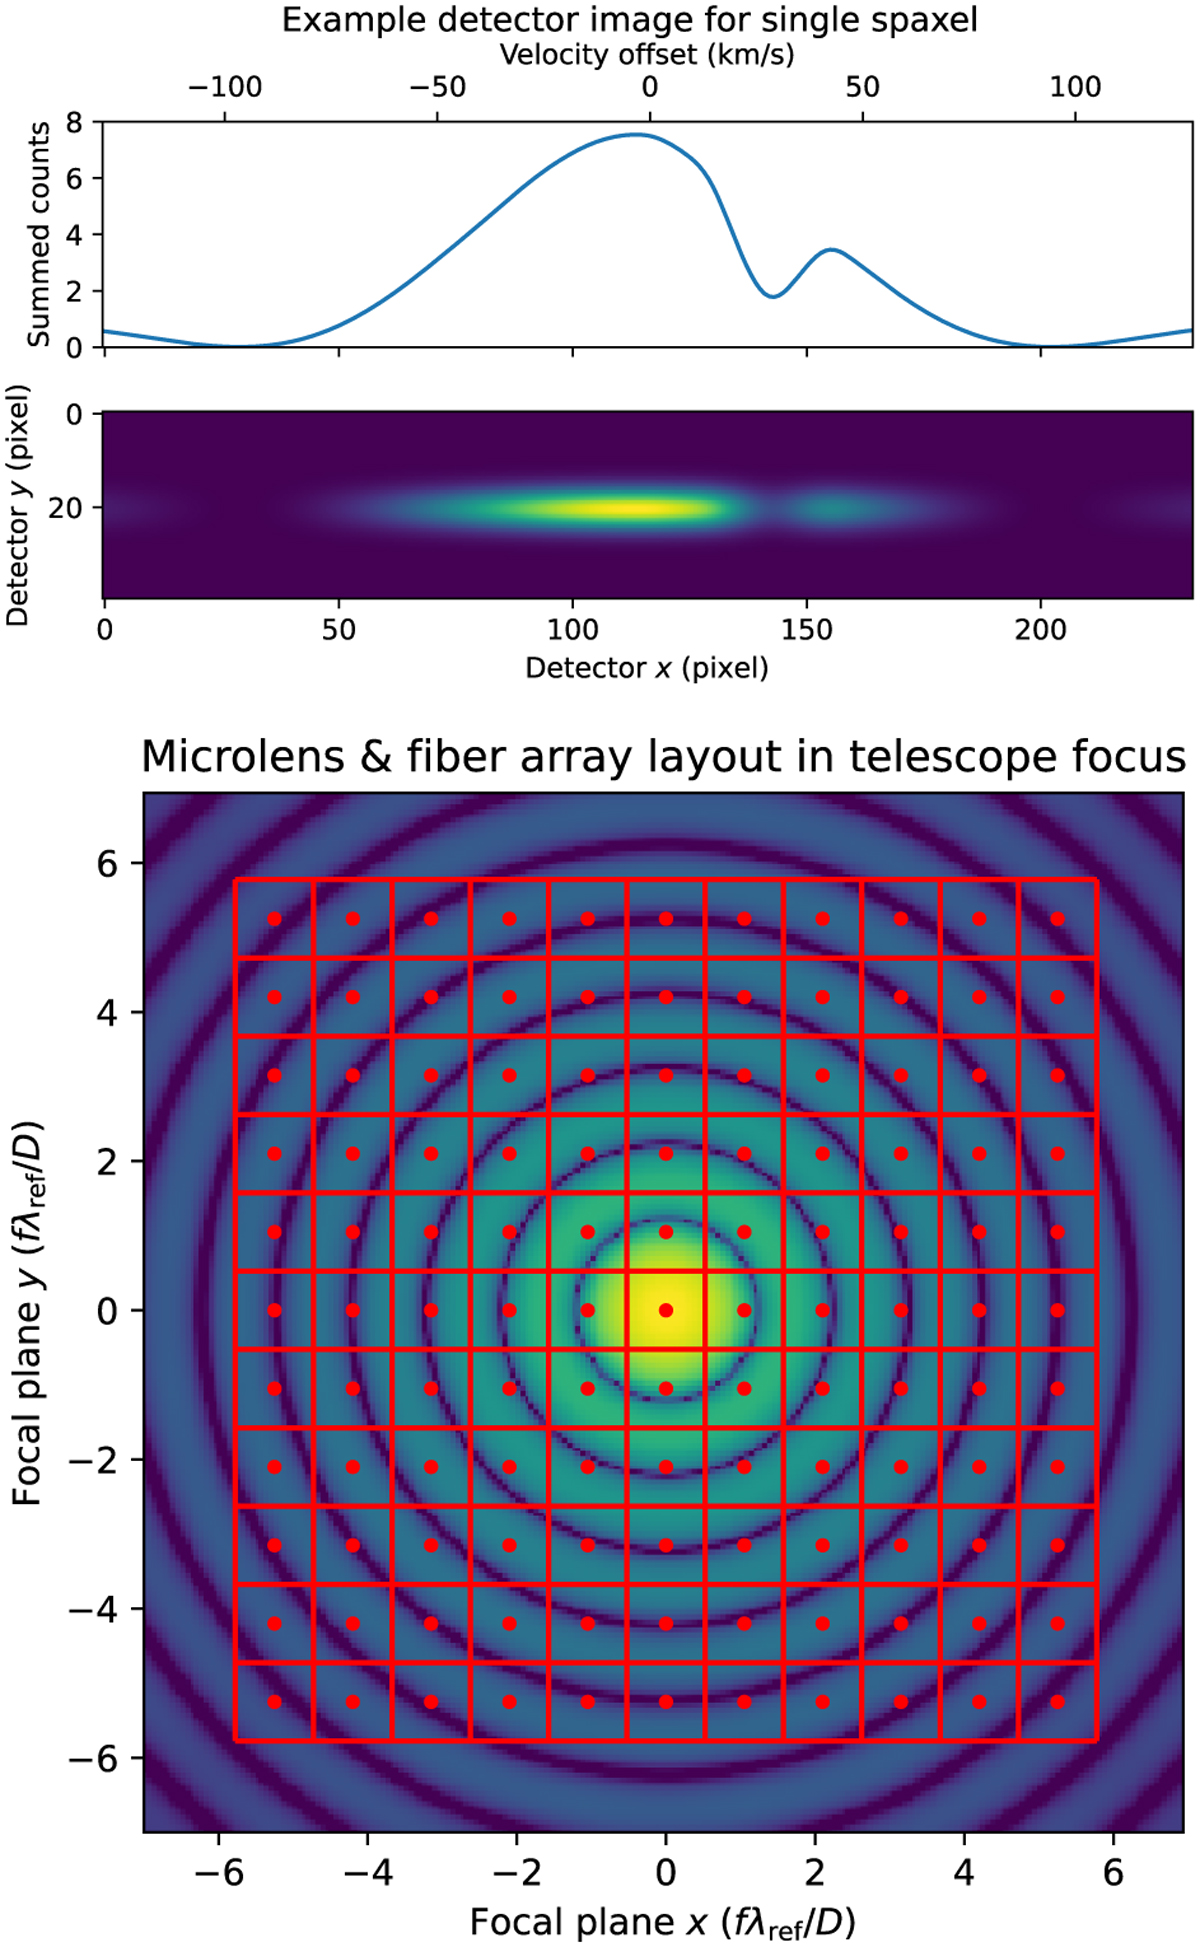
Example detector output for a single spaxel and the layout of the micro-lens and input fiber array in the telescope focus. The top figure shows both the simulated detector image and that image summed along one axis. The top x-axis gives the velocity offset from the Bragg wavelength corresponding to the pixel values. The figure uses the data for a single spaxel with one multiplexed Bragg grating with Bragg wavelength 1.083 µm and the emission spectrum of the planet. The planet has an absorption feature between the 0 and 50 km s−1 velocity offsets. The bottom figure shows the boundaries of each micro-lens in the micro-lens array with red lines and the fiber positions behind the micro-lens array with red dots. The Airy pattern visible beneath is a perfect Airy pattern at wavelength λref to illustrate the rough position of each fiber.
Current usage metrics show cumulative count of Article Views (full-text article views including HTML views, PDF and ePub downloads, according to the available data) and Abstracts Views on Vision4Press platform.
Data correspond to usage on the plateform after 2015. The current usage metrics is available 48-96 hours after online publication and is updated daily on week days.
Initial download of the metrics may take a while.