Fig. 10
Download original image
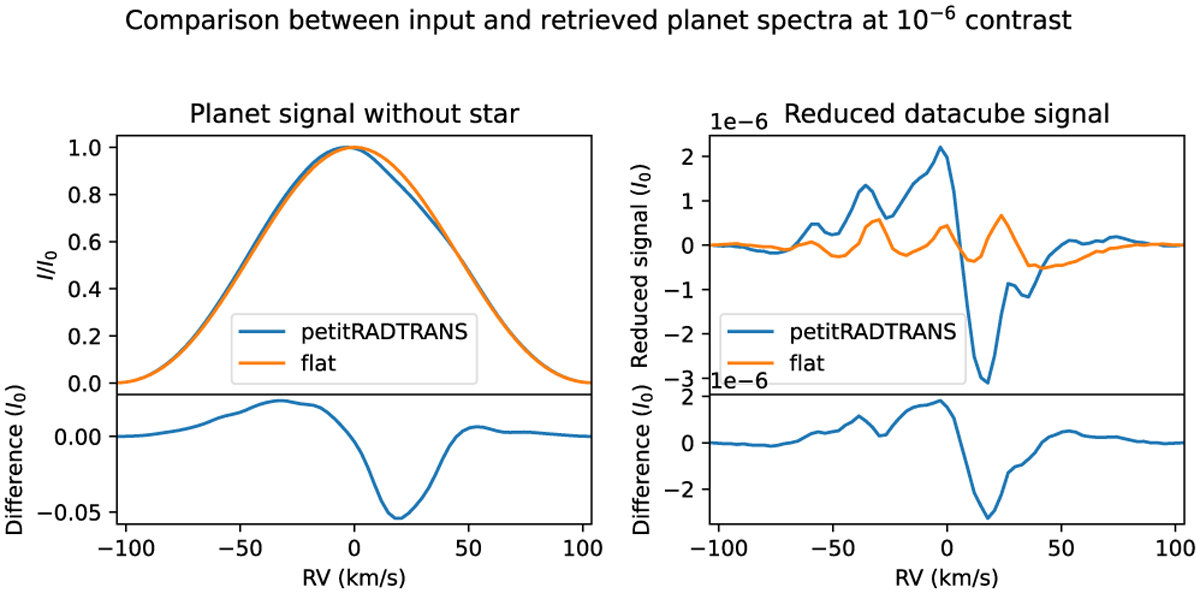
Comparison between results from the petitRADTRANS simulated emission spectrum and a flat emission spectrum for the planet without the addition of any noise. The left panel shows the spectra of the planet spaxel without the addition of any stellar light, with the difference of the two curves plotted below. The right panel shows the residuals of analyzed data cubes with stellar and planetary light for the two planetary spectra. The planet contrast in these data cubes is set to 10−6 and at a separation of ~3λ/D. The bottom panel again shows the difference between the curves.
Current usage metrics show cumulative count of Article Views (full-text article views including HTML views, PDF and ePub downloads, according to the available data) and Abstracts Views on Vision4Press platform.
Data correspond to usage on the plateform after 2015. The current usage metrics is available 48-96 hours after online publication and is updated daily on week days.
Initial download of the metrics may take a while.