Fig. 8.
Download original image
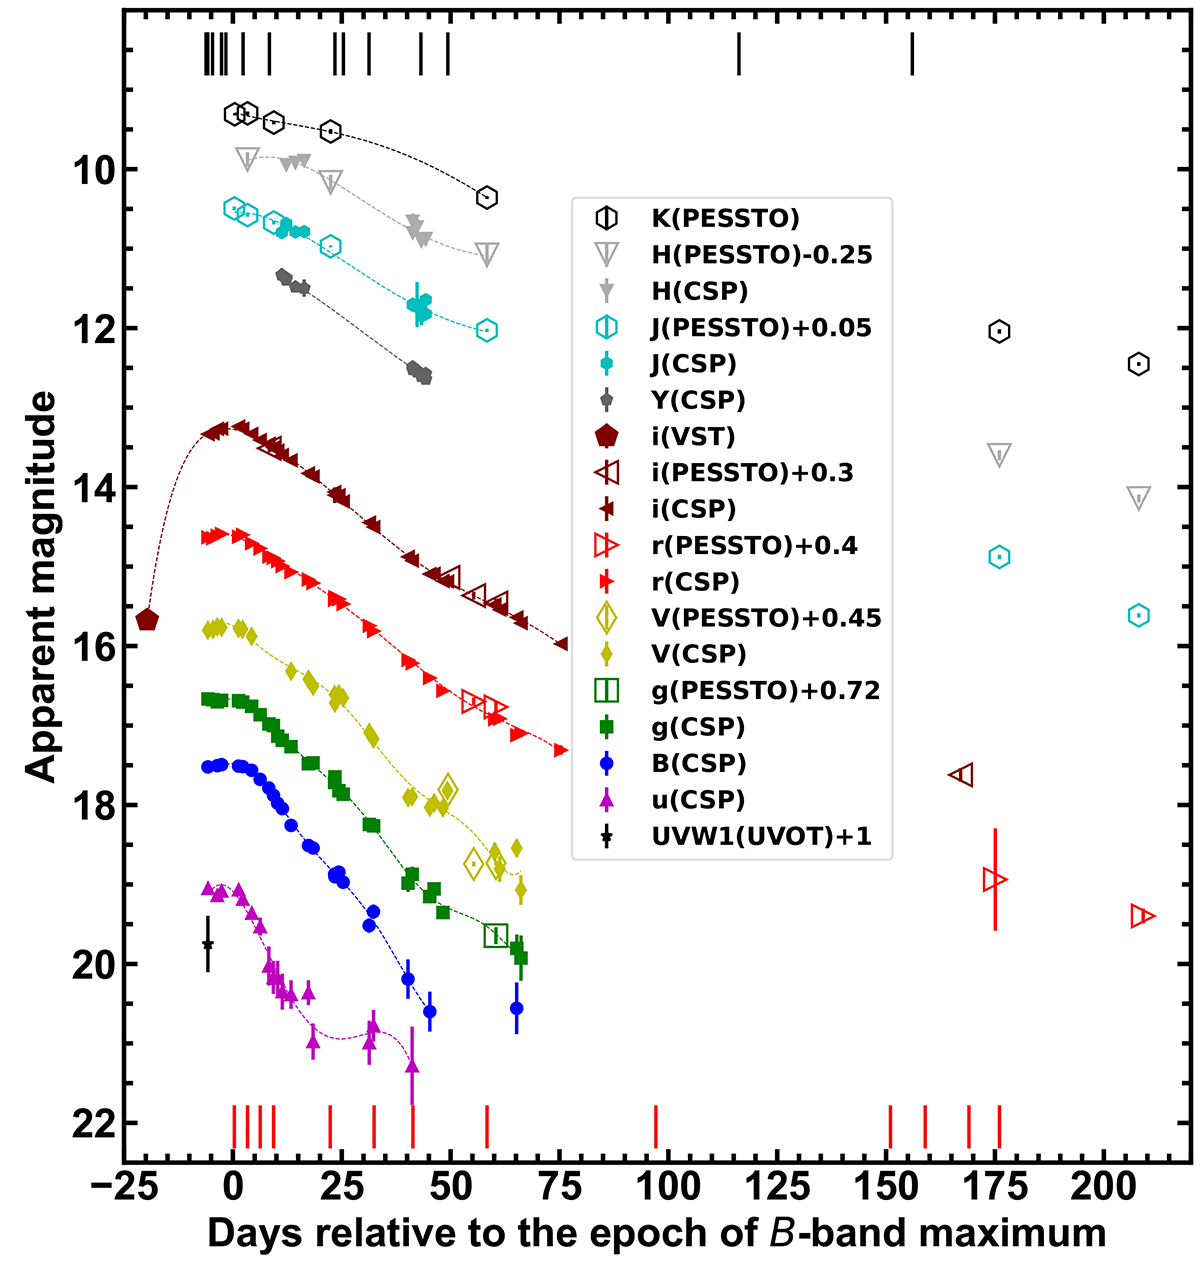
Optical and NIR photometry of SN 2016adj plotted relative to the epoch of the B-band maximum from observations obtained by CSP-II, PESSTO, with the ESO-Paranal VLT Survey Telescope (VST) equipped with OmegaCAM, and with the UVOT camera on board Swift. To facilitate the comparison of photometry obtained with different instruments, in some cases offsets have been applied as indicated in the legend. A low-order polynomial function is overplotted on each light curve and used to infer the time and value of peak. Epochs of spectroscopic observations are indicated by black (visual) and red (NIR) segments.
Current usage metrics show cumulative count of Article Views (full-text article views including HTML views, PDF and ePub downloads, according to the available data) and Abstracts Views on Vision4Press platform.
Data correspond to usage on the plateform after 2015. The current usage metrics is available 48-96 hours after online publication and is updated daily on week days.
Initial download of the metrics may take a while.