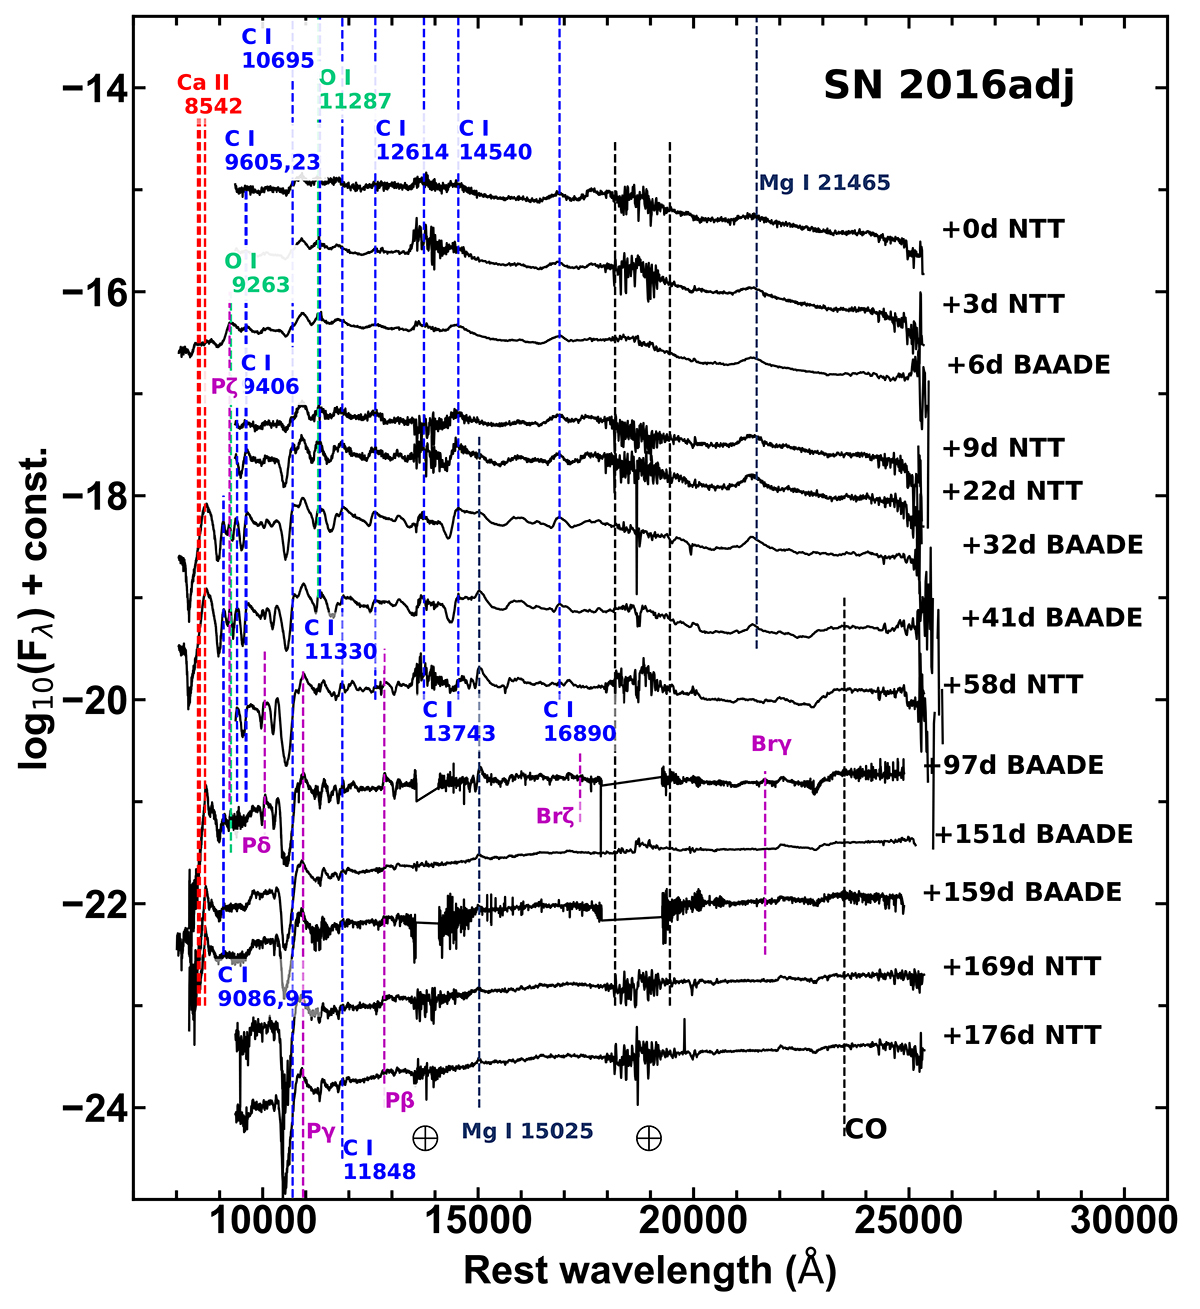
Fig. 4.
Download original image
NIR spectral time series of SN 2016adj covering 6 months of evolution beginning from the epoch of the B-band maximum. The phase and telescope are indicated to the right of the spectra. The locations of various spectral features are identified with vertical dashed lines and labeled. The lines indicate the spectra where the features are identified. Telluric regions were labeled with an Earth symbol.
Current usage metrics show cumulative count of Article Views (full-text article views including HTML views, PDF and ePub downloads, according to the available data) and Abstracts Views on Vision4Press platform.
Data correspond to usage on the plateform after 2015. The current usage metrics is available 48-96 hours after online publication and is updated daily on week days.
Initial download of the metrics may take a while.