Open Access
Fig. 3.
Download original image
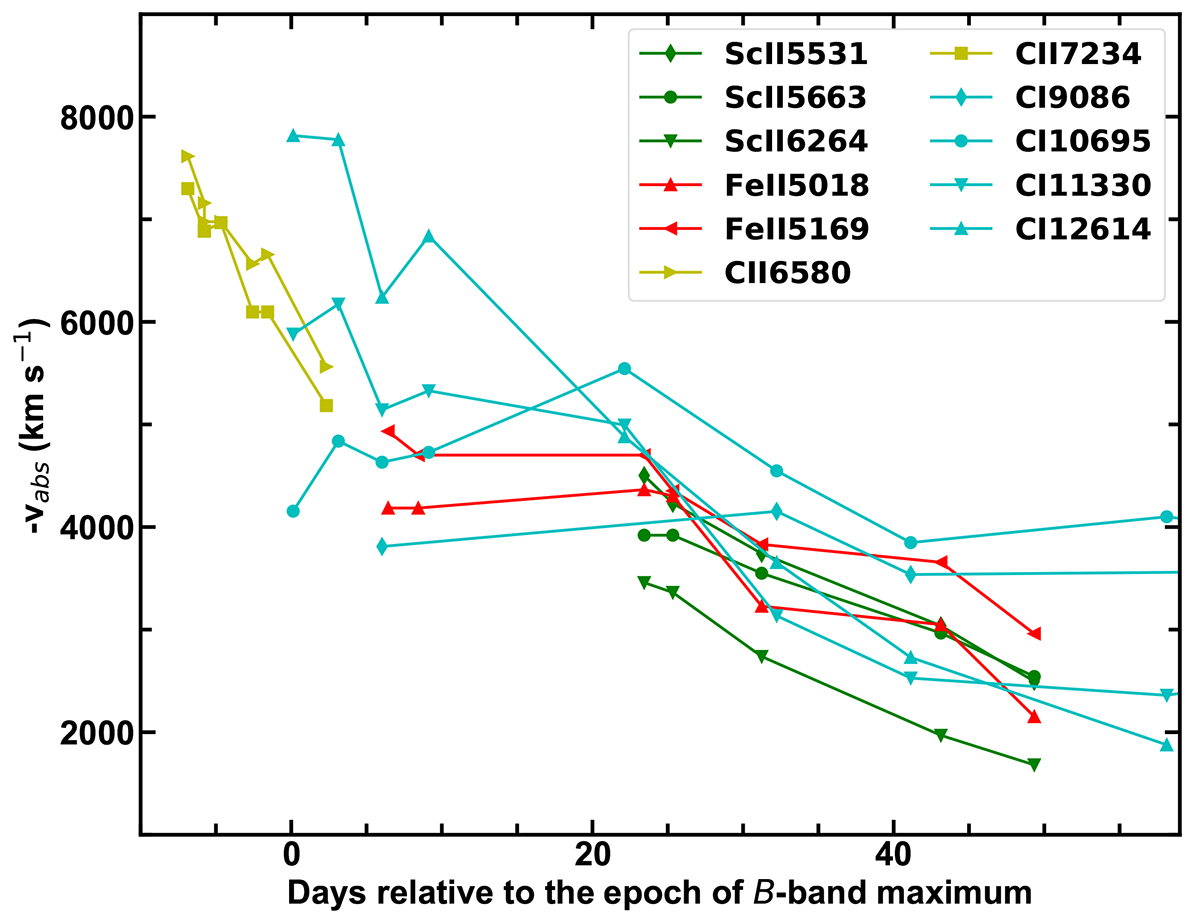
Measurements of −vabs for a handful of mostly prominent features (see legend) in the optical and NIR spectra of SN 2016adj, plotted vs. days relative to the epoch of the B-band maximum.
Current usage metrics show cumulative count of Article Views (full-text article views including HTML views, PDF and ePub downloads, according to the available data) and Abstracts Views on Vision4Press platform.
Data correspond to usage on the plateform after 2015. The current usage metrics is available 48-96 hours after online publication and is updated daily on week days.
Initial download of the metrics may take a while.