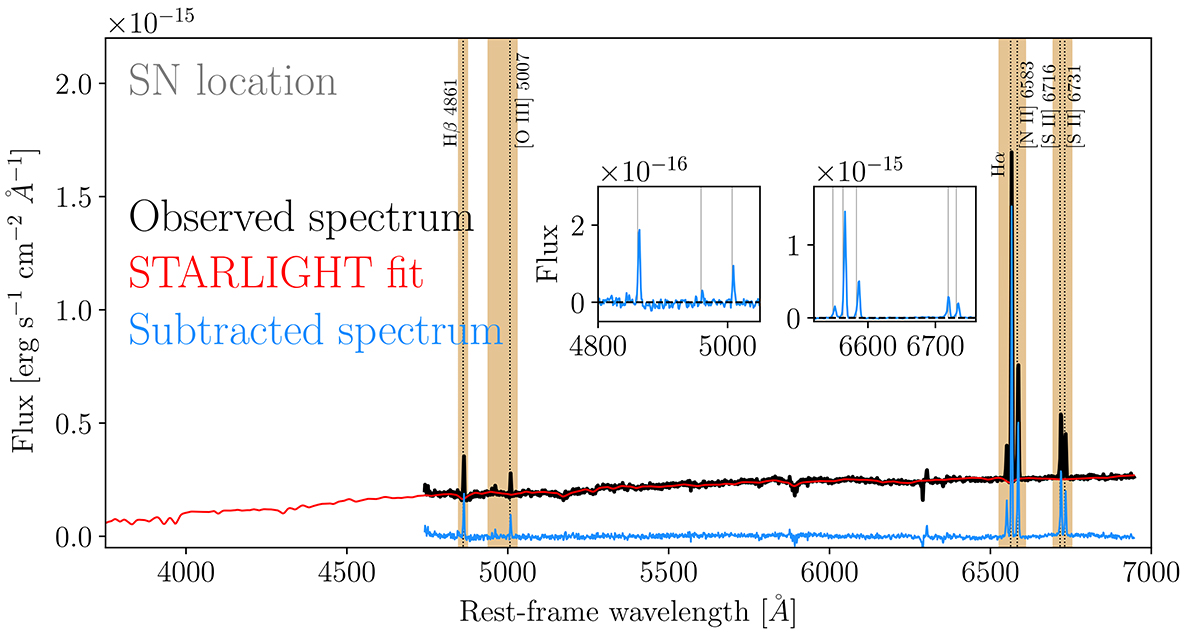
Fig. B.2.
Download original image
The 1D spectrum extracted from the MUSE observations at the location of SN 2016adj with prominent nebular emission features from the host labeled. The underlying stellar population was estimated using STARLIGHT (red line) and subtracted from the observed spectrum. The resulting gas-phase spectrum is shown in blue. A single Gaussian function was then fit to the nebular lines plotted within the insets. Flux ratios of these lines combined with the calibrations of Marino et al. (2013) and Dopita et al. (2016) indicate gas-phase 03N2 meallicities of (12 + log10(O/H)) = 8.55 ± 0.18 dex and 8.71±0.18 dex, respectively.
Current usage metrics show cumulative count of Article Views (full-text article views including HTML views, PDF and ePub downloads, according to the available data) and Abstracts Views on Vision4Press platform.
Data correspond to usage on the plateform after 2015. The current usage metrics is available 48-96 hours after online publication and is updated daily on week days.
Initial download of the metrics may take a while.