Fig. B.1.
Download original image
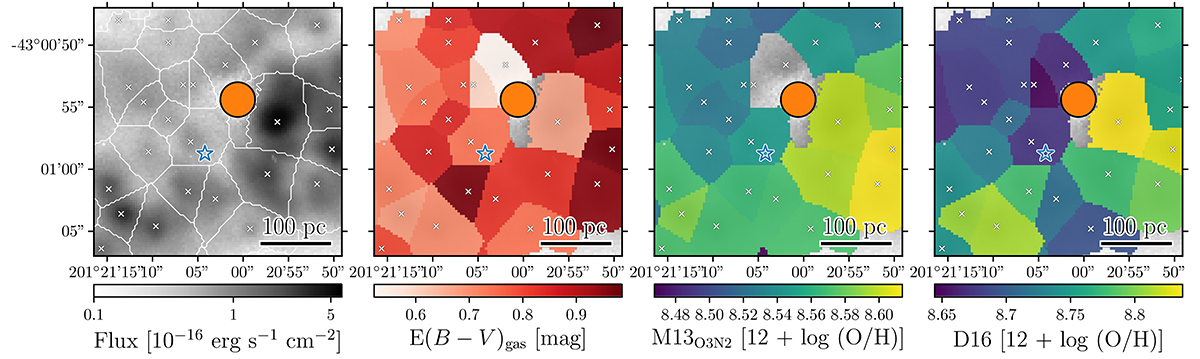
Spaxel binned MUSE data cube revealing (from left to right) the Hα flux (panel 1), the Balmer decrement-based ![]() color excess map (panel 2), and the O3N2 gas phase metallicity maps computed using the Marino et al. (2013, panel 3) and Dopita et al. (2016, panel 4) calibrations. The position of SN 2016adj is indicated in each panel by a star, crosses reveal H II-region peaks, and the bright foreground star in close proximity of the position of SN 2016adj is masked by a orange circle.
color excess map (panel 2), and the O3N2 gas phase metallicity maps computed using the Marino et al. (2013, panel 3) and Dopita et al. (2016, panel 4) calibrations. The position of SN 2016adj is indicated in each panel by a star, crosses reveal H II-region peaks, and the bright foreground star in close proximity of the position of SN 2016adj is masked by a orange circle.
Current usage metrics show cumulative count of Article Views (full-text article views including HTML views, PDF and ePub downloads, according to the available data) and Abstracts Views on Vision4Press platform.
Data correspond to usage on the plateform after 2015. The current usage metrics is available 48-96 hours after online publication and is updated daily on week days.
Initial download of the metrics may take a while.