Open Access
Fig. 16.
Download original image
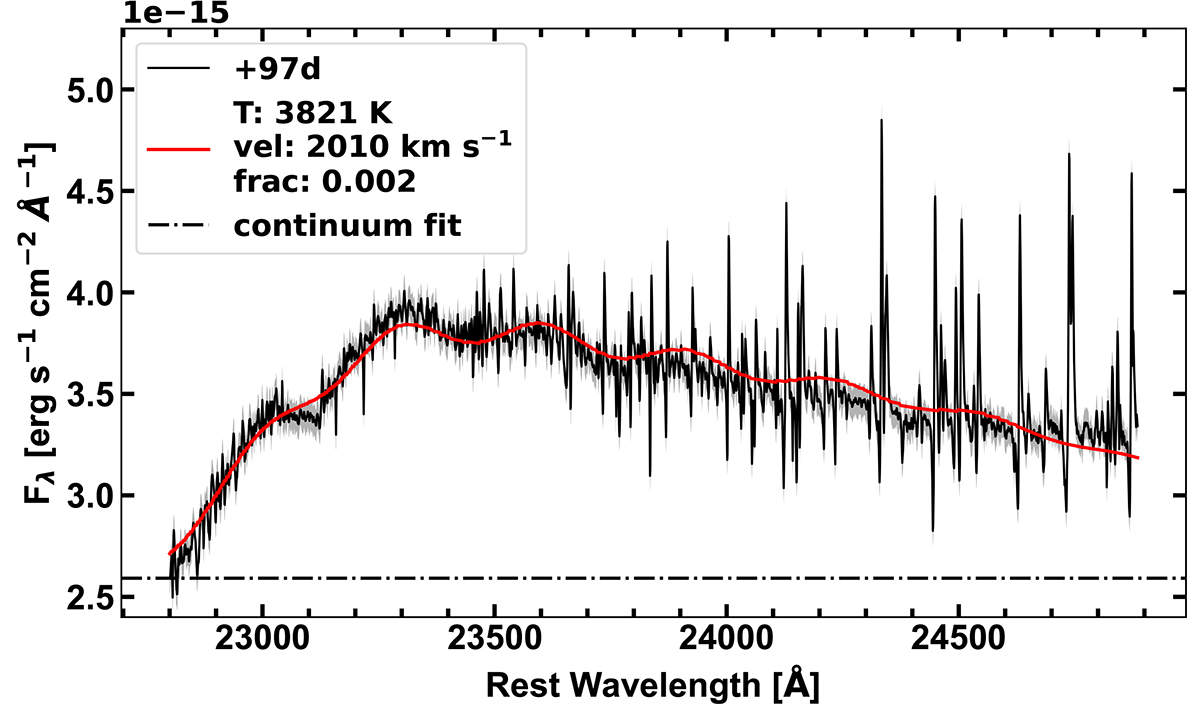
First CO overtone feature in the +97 days NIR medium-resolution spectrum of SN 2016adj (solid black line) compared with the best-fit model (solid red line) characterized by the parameters listed in the legend. The dot-dashed black line corresponds to the underlying continuum flux.
Current usage metrics show cumulative count of Article Views (full-text article views including HTML views, PDF and ePub downloads, according to the available data) and Abstracts Views on Vision4Press platform.
Data correspond to usage on the plateform after 2015. The current usage metrics is available 48-96 hours after online publication and is updated daily on week days.
Initial download of the metrics may take a while.