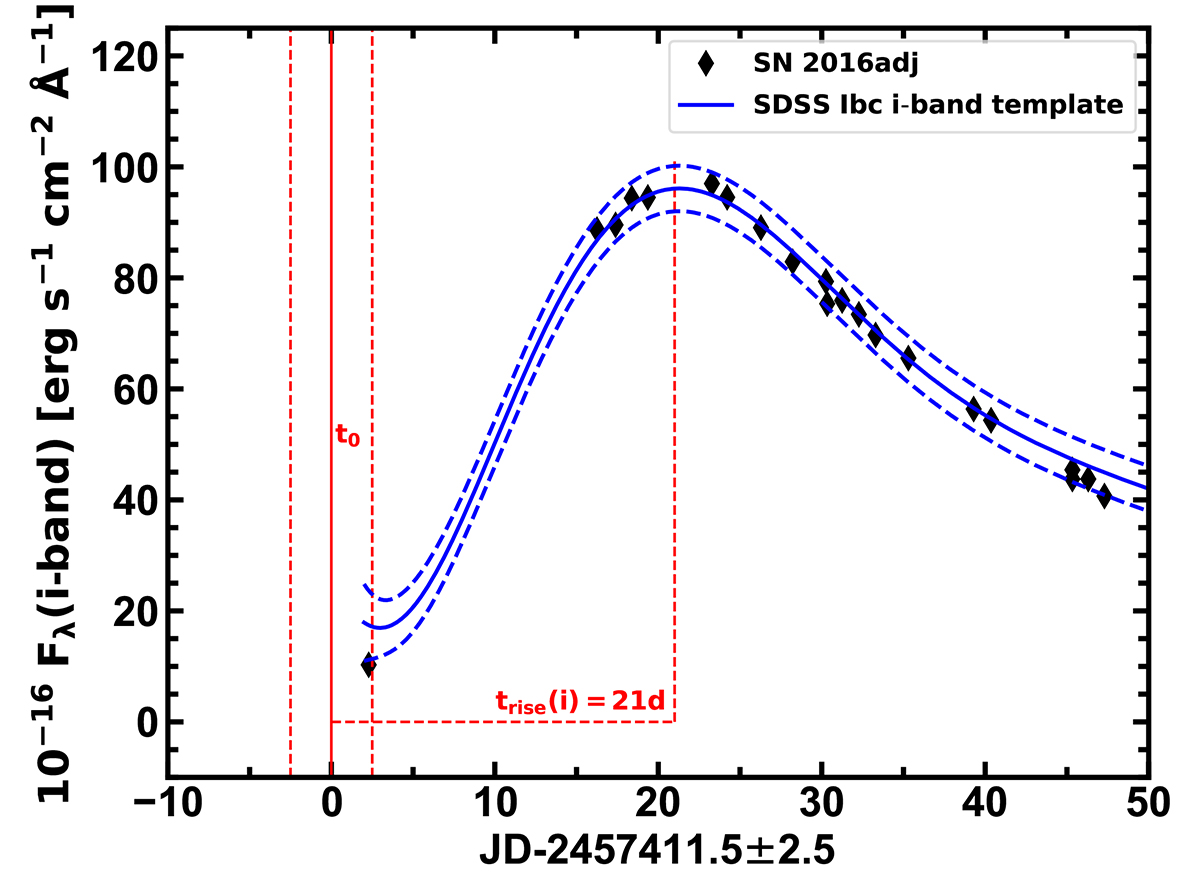
Fig. 14.
Download original image
Observed i-band photometry of SN 2016adj in flux units (black symbols) vs. days relative to the estimated explosion epoch (JD–2457411.5 ± 2.5). Overplotted as a blue solid line is the SN Ib/c i-band template light curve presented by Taddia et al. (2015), scaled and shifted to match the light curve of SN 2016adj. The blue dashed lines corresponds to a 1-σ uncertainty error snake. The epoch of the inferred explosion time, t0, is indicated by the vertical red solid line and assumes an i-band rise time of 21 days (see Taddia et al. 2015). The time difference between the inferred explosion date and the first i-band epoch is 2.5 days, which corresponds to the uncertainty of our estimated rise time.
Current usage metrics show cumulative count of Article Views (full-text article views including HTML views, PDF and ePub downloads, according to the available data) and Abstracts Views on Vision4Press platform.
Data correspond to usage on the plateform after 2015. The current usage metrics is available 48-96 hours after online publication and is updated daily on week days.
Initial download of the metrics may take a while.