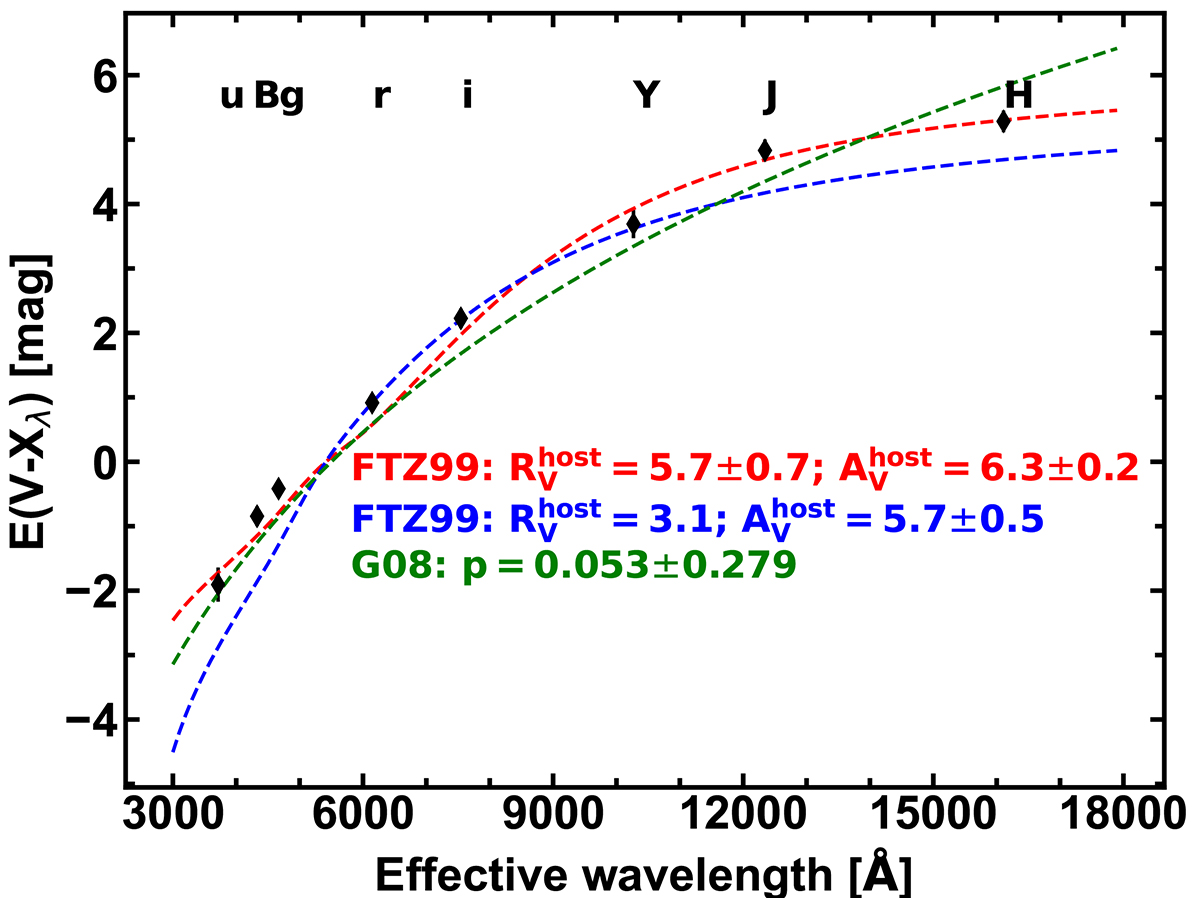
Fig. 10.
Download original image
Optical and NIR E(V − X)host (where X = u, B, g, r, i, Y, J, H) color excess measurements of SN 2016adj, plotted as a function of the effective wavelength of passband X. Each color excess measurement represents the difference between the observed color (corrected for E(B − V)MW) and the intrinsic color-curve template for SN Ic shown in Fig. 9. The red dashed line corresponds to the best Fitzpatrick (1999) reddening law model fit characterized by a ratio of total-to-selective absorption ![]() = 5.7 ± 0.7 and a visual extinction
= 5.7 ± 0.7 and a visual extinction ![]() = 6.3 ± 0.2 mag. Also shown are the best Fitzpatrick (1999) reddening law model fits with
= 6.3 ± 0.2 mag. Also shown are the best Fitzpatrick (1999) reddening law model fits with ![]() = 3.1 (blue dashed line), and the best-fit Goobar (2008) power-law model (green dashed line).
= 3.1 (blue dashed line), and the best-fit Goobar (2008) power-law model (green dashed line).
Current usage metrics show cumulative count of Article Views (full-text article views including HTML views, PDF and ePub downloads, according to the available data) and Abstracts Views on Vision4Press platform.
Data correspond to usage on the plateform after 2015. The current usage metrics is available 48-96 hours after online publication and is updated daily on week days.
Initial download of the metrics may take a while.