Open Access
Fig. 3.
Download original image
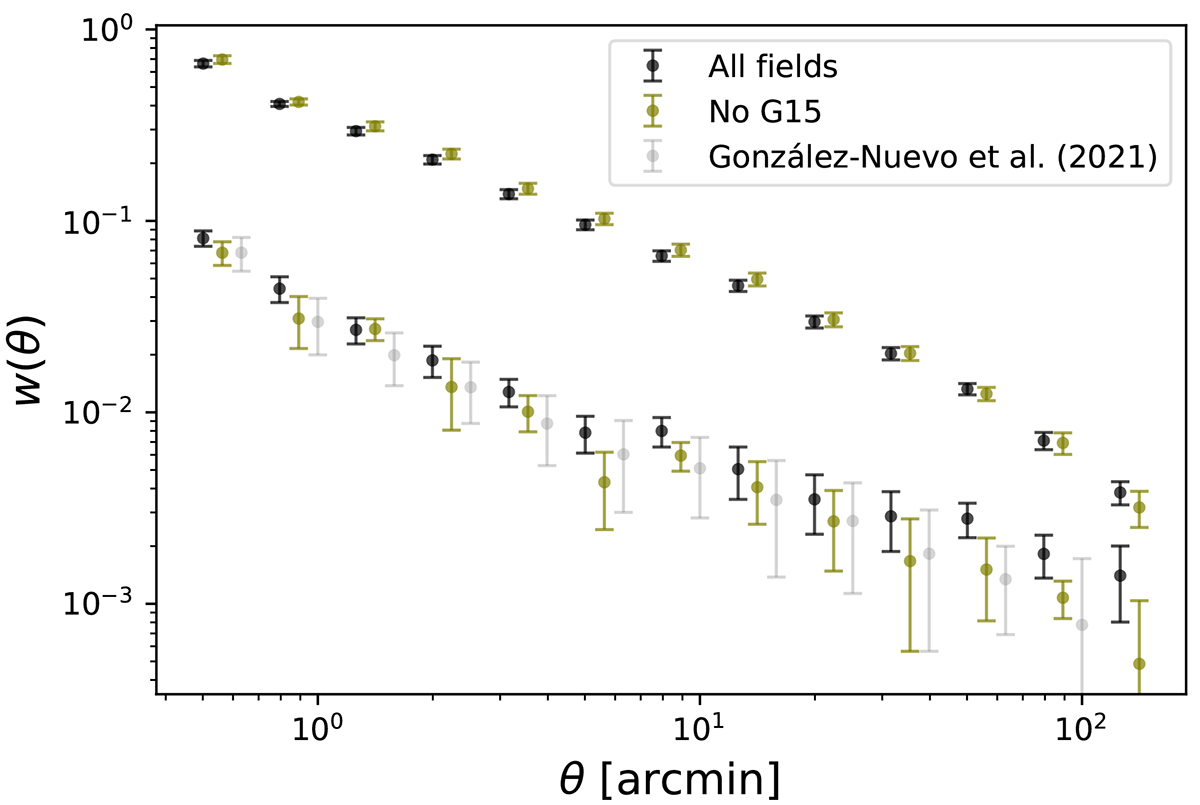
Measurements of the foreground auto-correlation function and the foreground-background cross-correlation function (in black) compared to the cross-correlation function excluding the G15 region (in olive green). The cross-correlation data from González-Nuevo et al. (2021) are shown in gray.
Current usage metrics show cumulative count of Article Views (full-text article views including HTML views, PDF and ePub downloads, according to the available data) and Abstracts Views on Vision4Press platform.
Data correspond to usage on the plateform after 2015. The current usage metrics is available 48-96 hours after online publication and is updated daily on week days.
Initial download of the metrics may take a while.