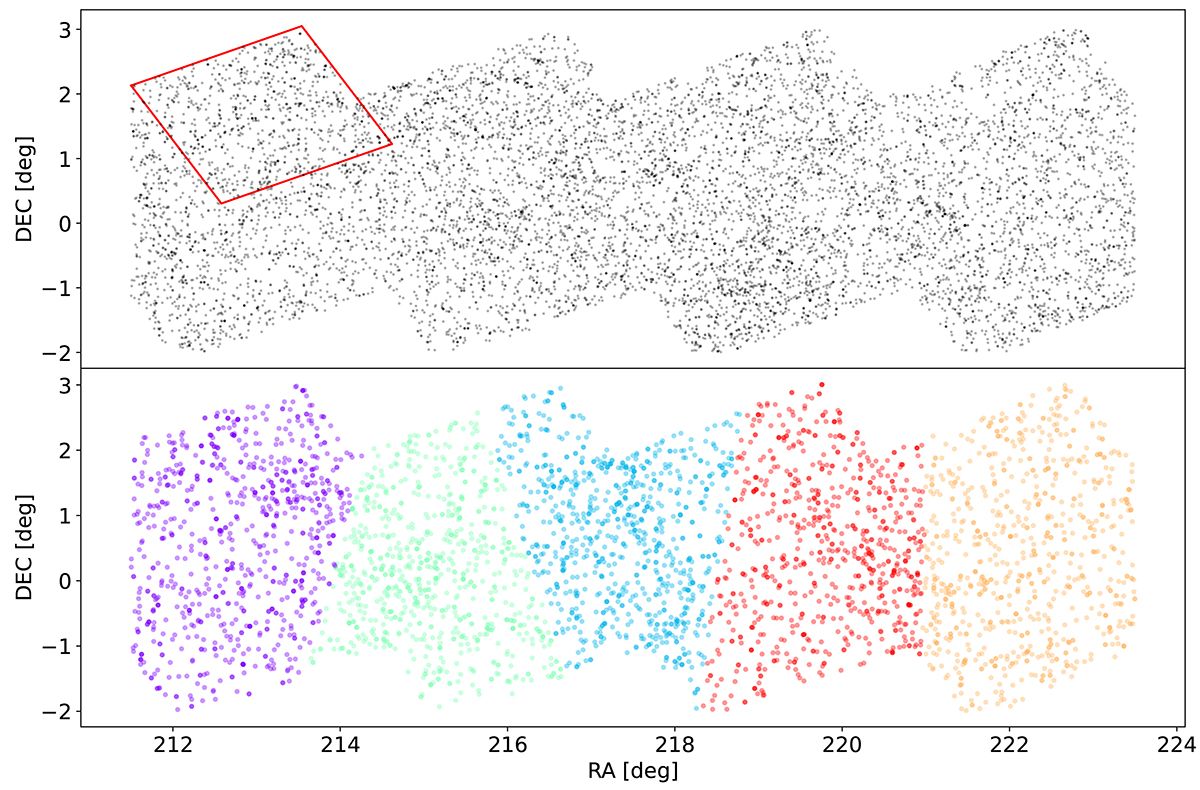
Fig. 2.
Download original image
Angular distribution of foreground (top panel) and background (bottom panel) sample galaxies in the G15 field. In the bottom panel, different colours indicate the definition of the patches used for the Bootstrap error estimation of the angular cross- and auto-correlations. The red square in the top panel indicates the typical shape and size of a minitile, used in previous works to divide the sample into subregions (see text for more details). The number density has been artificially reduced in both panels for loading and visualization purposes.
Current usage metrics show cumulative count of Article Views (full-text article views including HTML views, PDF and ePub downloads, according to the available data) and Abstracts Views on Vision4Press platform.
Data correspond to usage on the plateform after 2015. The current usage metrics is available 48-96 hours after online publication and is updated daily on week days.
Initial download of the metrics may take a while.