Open Access
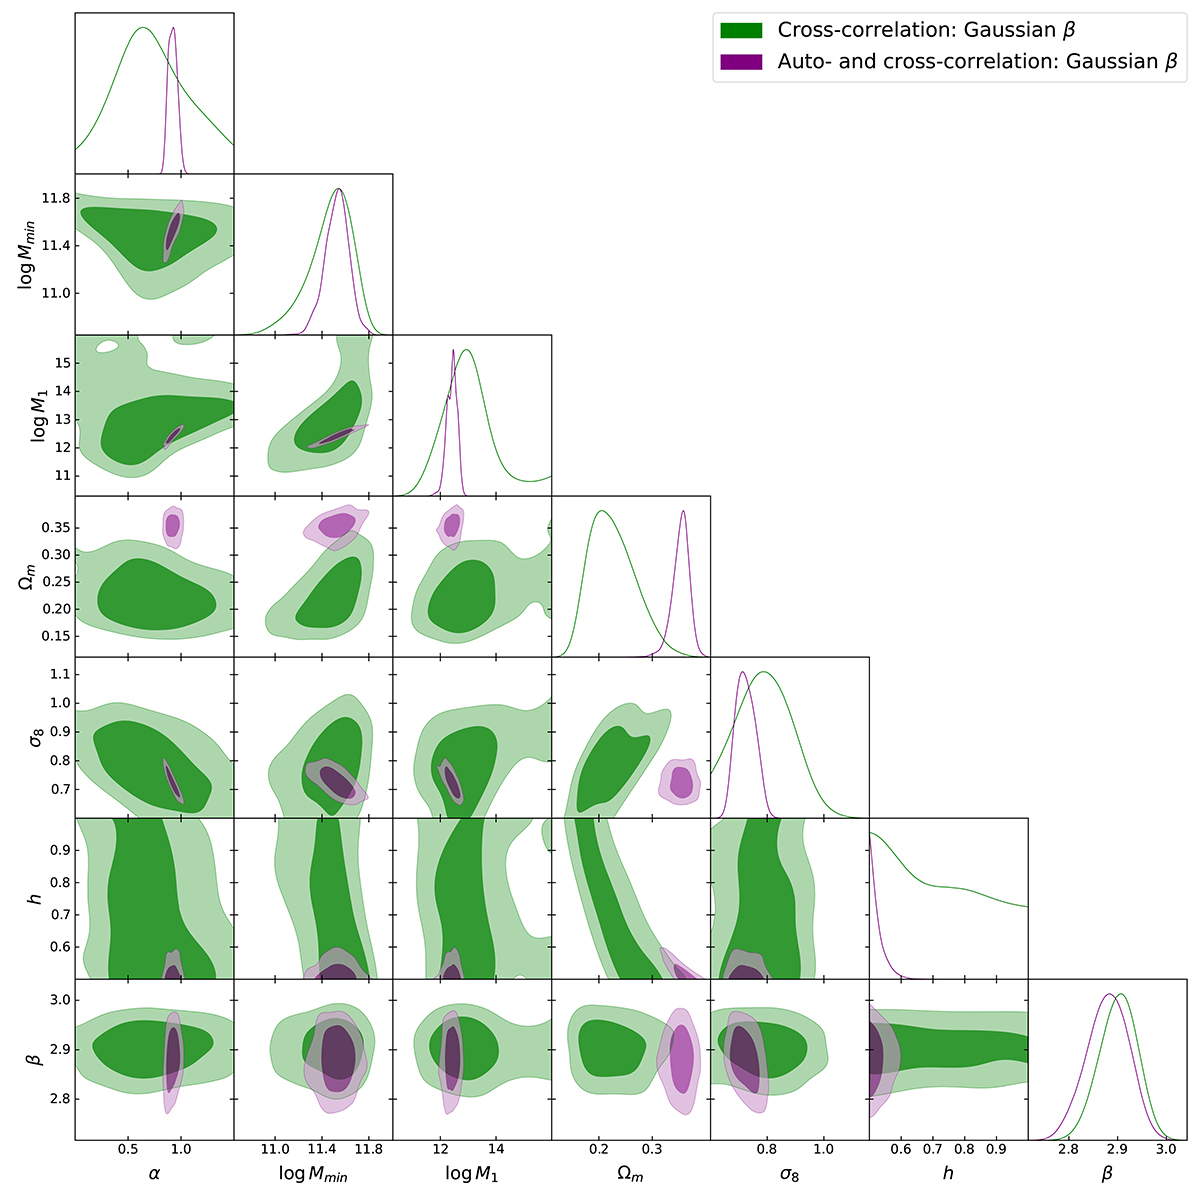
Fig. D.5.
Download original image
Marginalized posterior distributions and probability contours for the joint MCMC run on the cross- and auto-correlation functions in purple, compared with the corresponding ones using only the cross-correlation function in green. Both cases were run with a Gaussian prior on β.
Current usage metrics show cumulative count of Article Views (full-text article views including HTML views, PDF and ePub downloads, according to the available data) and Abstracts Views on Vision4Press platform.
Data correspond to usage on the plateform after 2015. The current usage metrics is available 48-96 hours after online publication and is updated daily on week days.
Initial download of the metrics may take a while.