Open Access
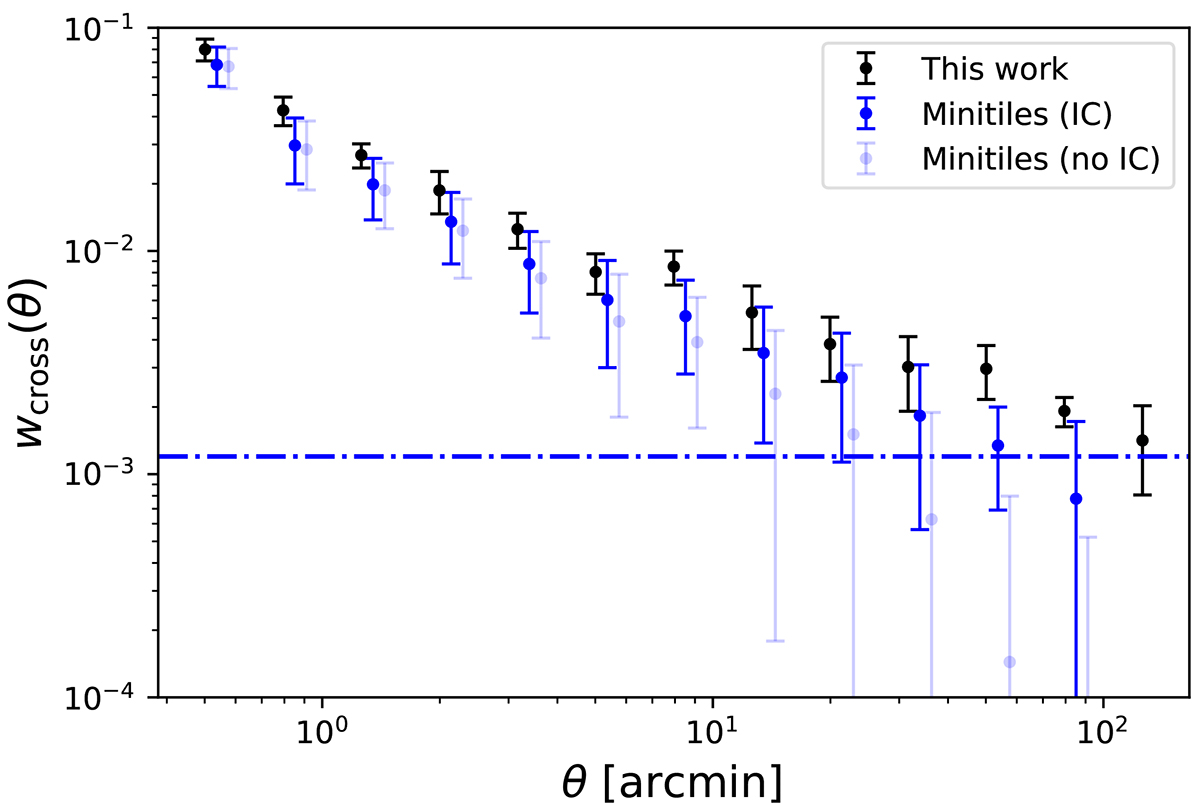
Fig. C.1.
Download original image
Angular cross-correlation data as measured in this work (in black) and using the minitiles strategy from González-Nuevo et al. (2021) (in blue). The light blue points represent the measurements without the IC correction, which is depicted by the dot-dashed line.
Current usage metrics show cumulative count of Article Views (full-text article views including HTML views, PDF and ePub downloads, according to the available data) and Abstracts Views on Vision4Press platform.
Data correspond to usage on the plateform after 2015. The current usage metrics is available 48-96 hours after online publication and is updated daily on week days.
Initial download of the metrics may take a while.