Fig. 3
Download original image
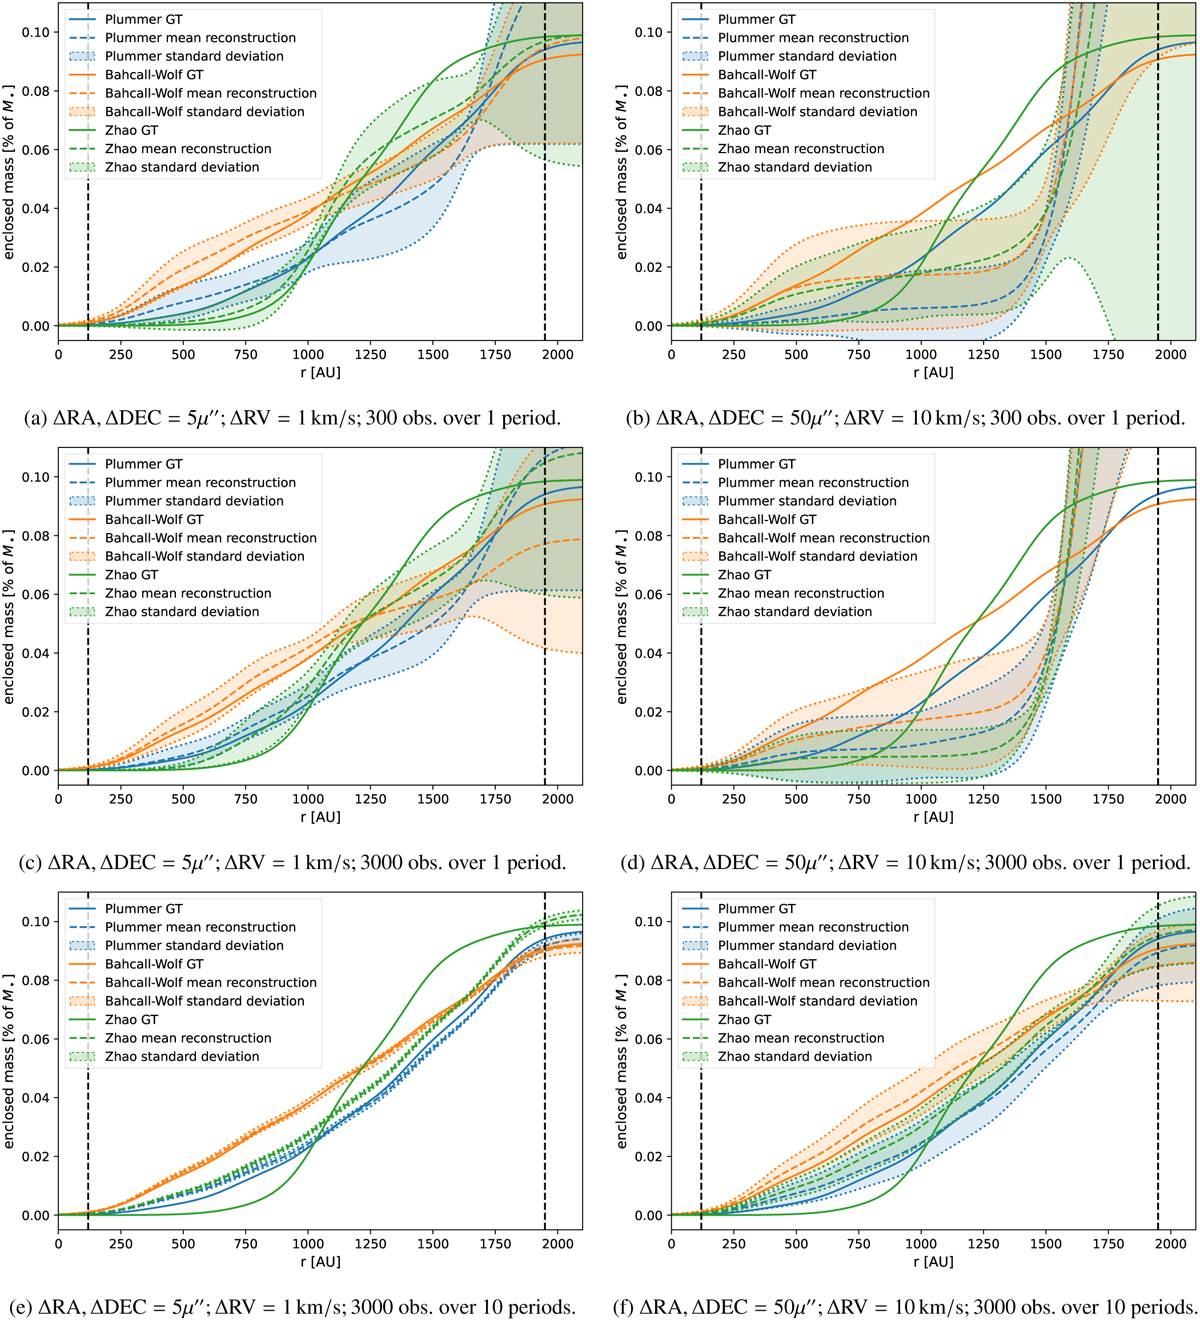
Statistics of reconstructed enclosed mass curves resulting from ten fits per ground truth case (Eq. (5)) to different mock data. Left: Measurement uncertainties of 5μ″, 1 km s−1, and initial guess drawn from IC2 of Table 1. Right: Measurement uncertainties of 50μ″, 10 km s−1, and initial guess drawn from IC3 of Table 1 (right). Top: 300 mock observations over one orbital period. Middle: 3000 mock observations over one orbital period. Bottom: 3000 mock observations over ten orbital periods. Also shown are the means (dashed), standard deviations (shaded), and shell approximated ground truth profiles (solid).
Current usage metrics show cumulative count of Article Views (full-text article views including HTML views, PDF and ePub downloads, according to the available data) and Abstracts Views on Vision4Press platform.
Data correspond to usage on the plateform after 2015. The current usage metrics is available 48-96 hours after online publication and is updated daily on week days.
Initial download of the metrics may take a while.