Fig. 3.
Download original image
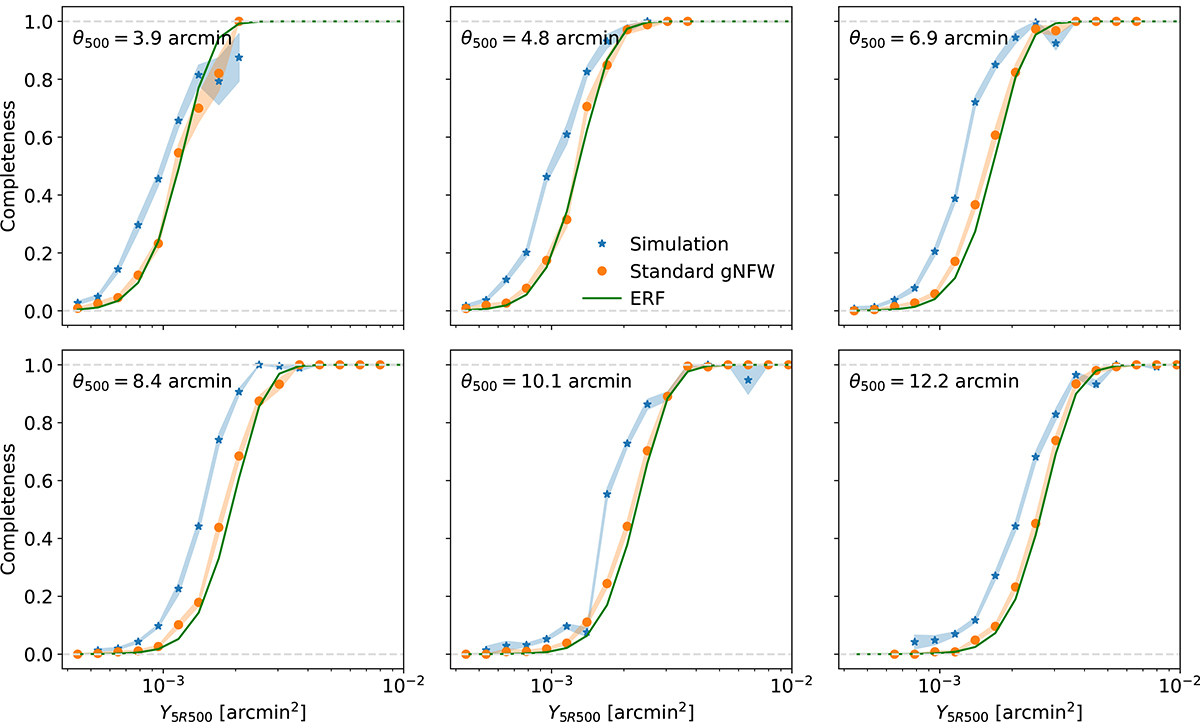
Completeness as a function of Y5R500 in six θ500 bins, computed with Monte Carlo injection for the simulation and circular sets of clusters (in blue and orange, respectively), and estimated with the ERF approximation, in green. The shaded areas represent the uncertainty on the completeness in each bin, computed via bootstrap resampling.
Current usage metrics show cumulative count of Article Views (full-text article views including HTML views, PDF and ePub downloads, according to the available data) and Abstracts Views on Vision4Press platform.
Data correspond to usage on the plateform after 2015. The current usage metrics is available 48-96 hours after online publication and is updated daily on week days.
Initial download of the metrics may take a while.