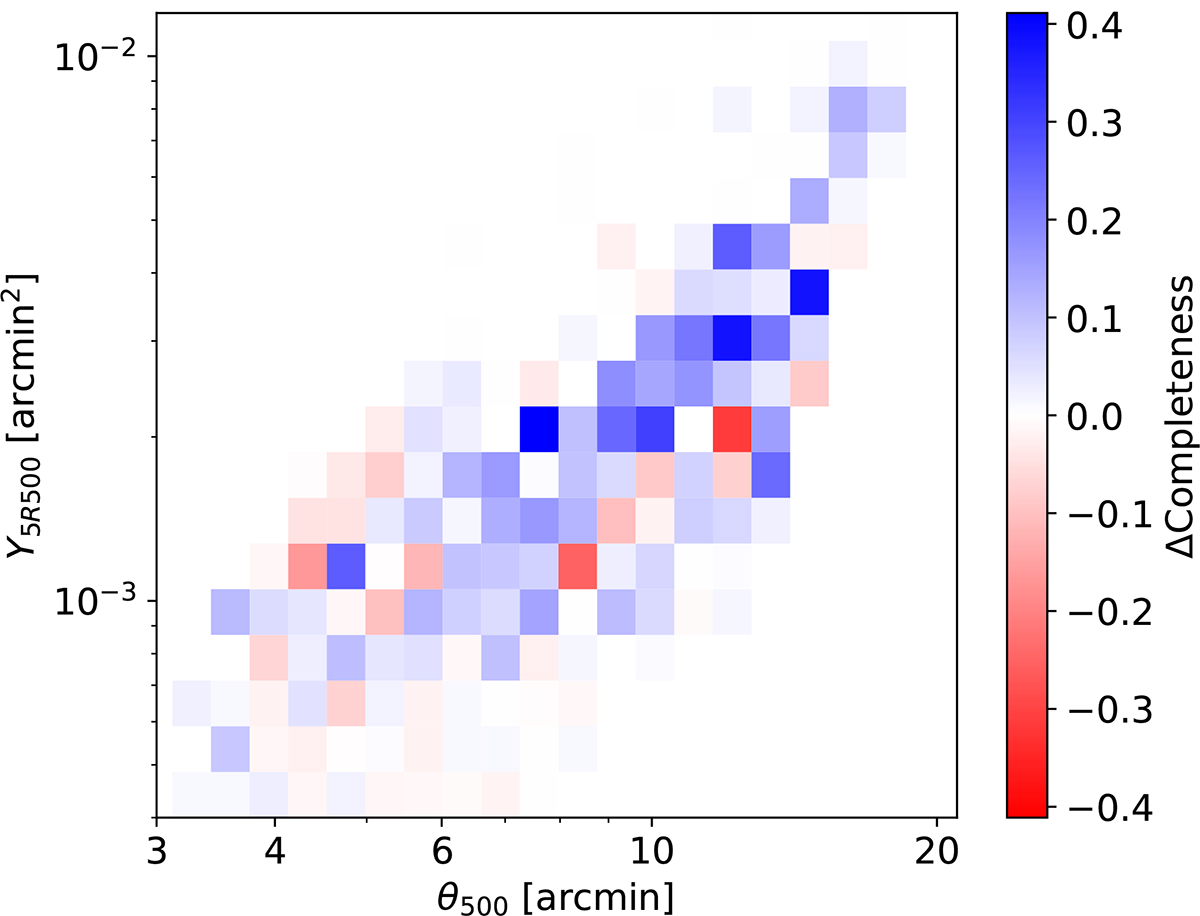
Fig. 10.
Download original image
Difference in completeness between the “more spherical” and “more elliptical” subsets of the simulation images, in bins of (θ500, Y5R500). The bins in blue are the ones in which the completeness from the “more spherical” subset is higher, while those in red are those in which the completeness of the “more elliptical” subset dominates.
Current usage metrics show cumulative count of Article Views (full-text article views including HTML views, PDF and ePub downloads, according to the available data) and Abstracts Views on Vision4Press platform.
Data correspond to usage on the plateform after 2015. The current usage metrics is available 48-96 hours after online publication and is updated daily on week days.
Initial download of the metrics may take a while.