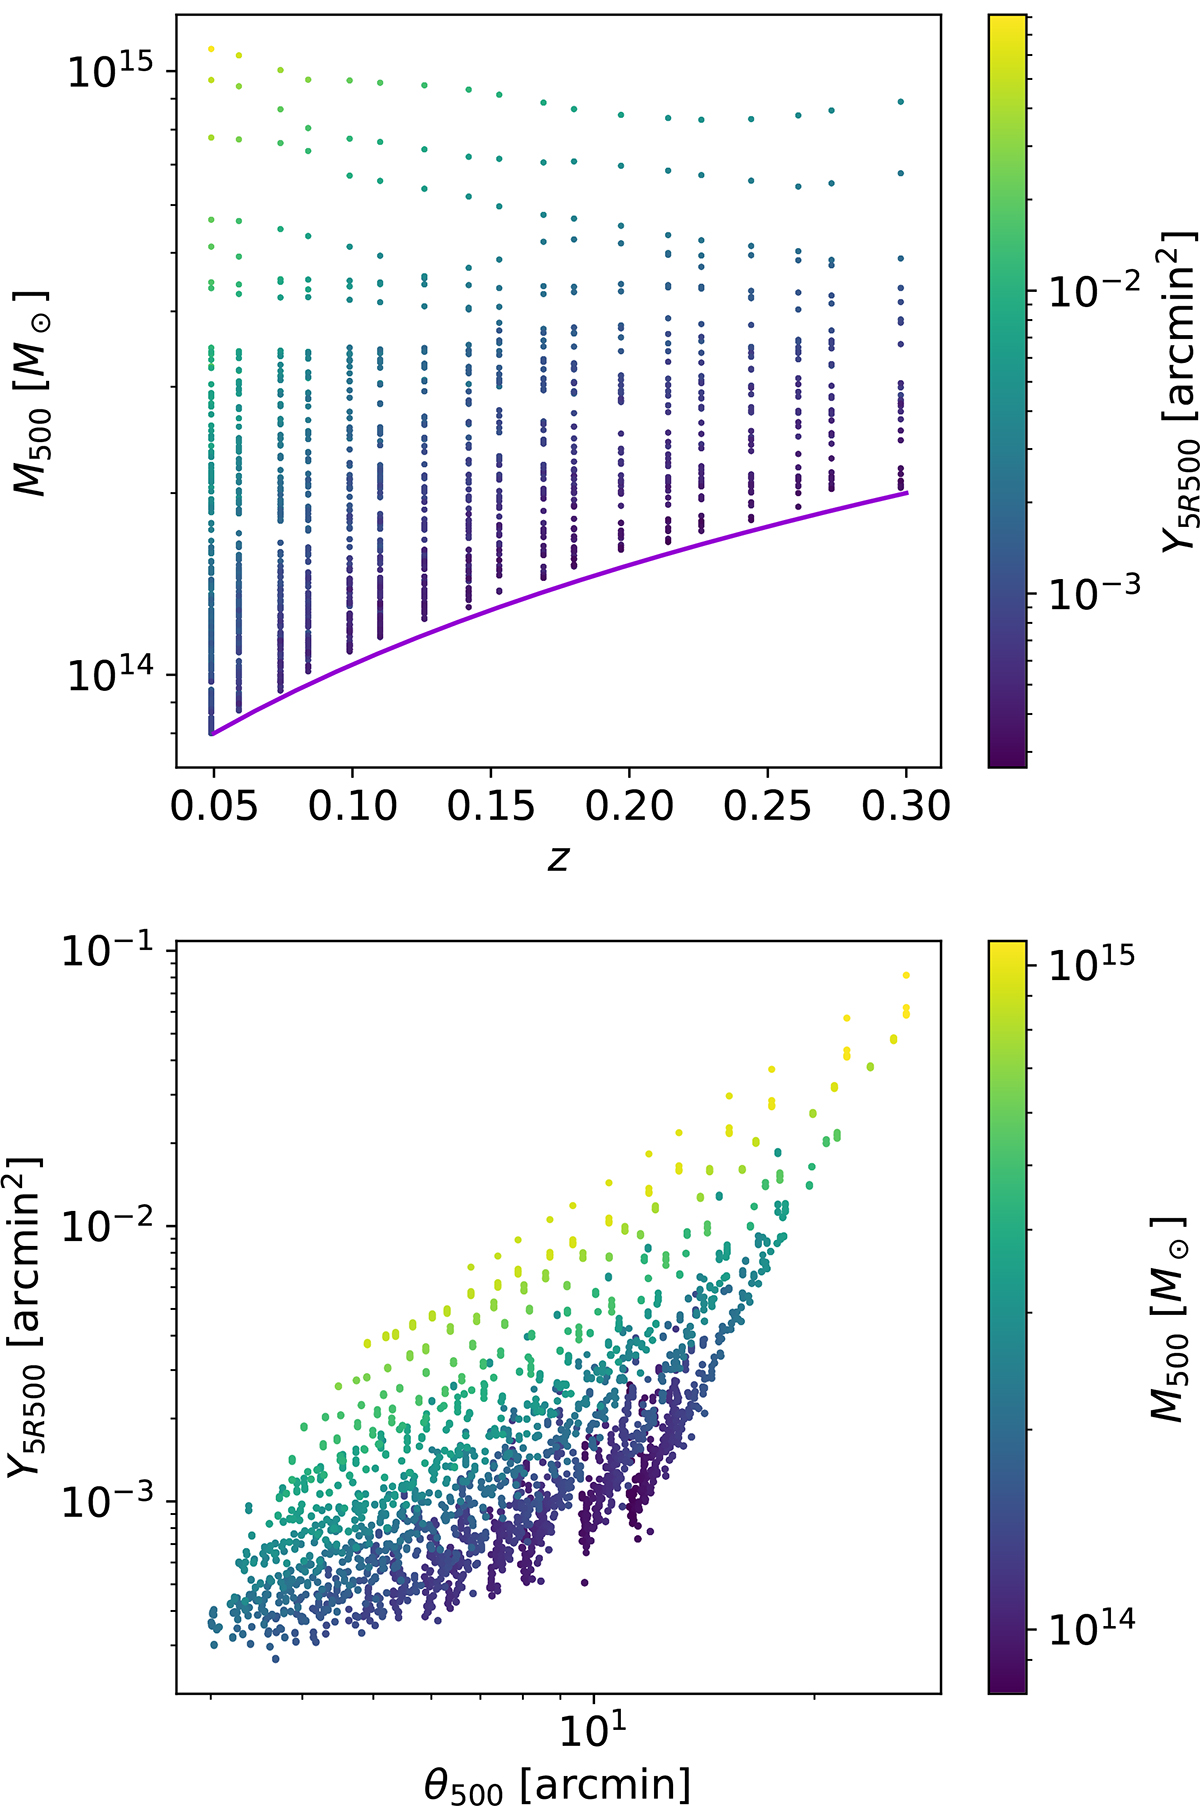
Fig. 1.
Download original image
Distribution of the galaxy clusters selected from the TNG300 simulation. Top panel: mass and redshift distribution of the galaxy clusters colour coded according to their Y5R500. The violet line shows the lower mass limit imposed in the selection and described in the text. Bottom panel: cluster distribution in integrated y signal, Y5R500, and angular scale, θ500, colour coded according to cluster mass M500.
Current usage metrics show cumulative count of Article Views (full-text article views including HTML views, PDF and ePub downloads, according to the available data) and Abstracts Views on Vision4Press platform.
Data correspond to usage on the plateform after 2015. The current usage metrics is available 48-96 hours after online publication and is updated daily on week days.
Initial download of the metrics may take a while.