Fig. 8
Download original image
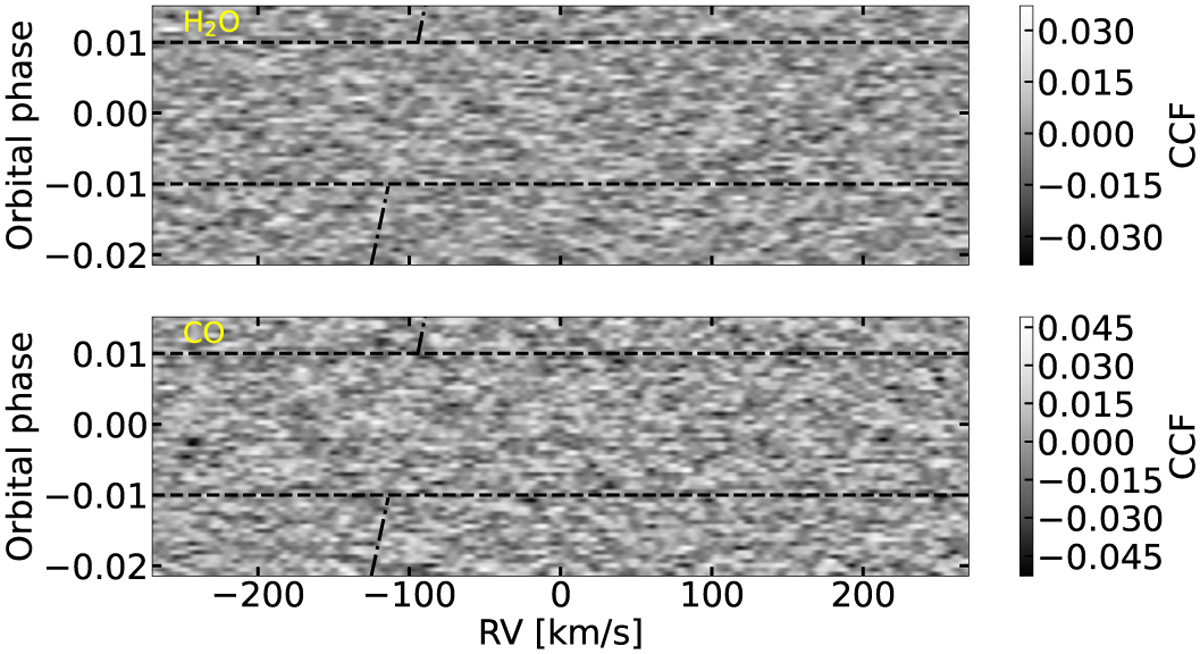
Examples of CCF values as a function of planetary orbital phase computed with data from the second observing night (18 June 2020) and model containing only H2O (top panel) or CO (bottom panel) lines. The horizontal dashed lines represent the transit ingress and egress while the dash-dotted line represents the expected CCF peak trail due to the planetary motion as measured in the observer rest frame. The expected CCF peak trail in transit is not represented for clarity. As it can be seen, due to the faintness of the signal, the CCF peak trail is not visible by eye. This kind of plots serves as a visual check of any remaining telluric and stellar residuals, in this case showing no residuals and signifying that these are adequately corrected by the PCA.
Current usage metrics show cumulative count of Article Views (full-text article views including HTML views, PDF and ePub downloads, according to the available data) and Abstracts Views on Vision4Press platform.
Data correspond to usage on the plateform after 2015. The current usage metrics is available 48-96 hours after online publication and is updated daily on week days.
Initial download of the metrics may take a while.