Fig. 7
Download original image
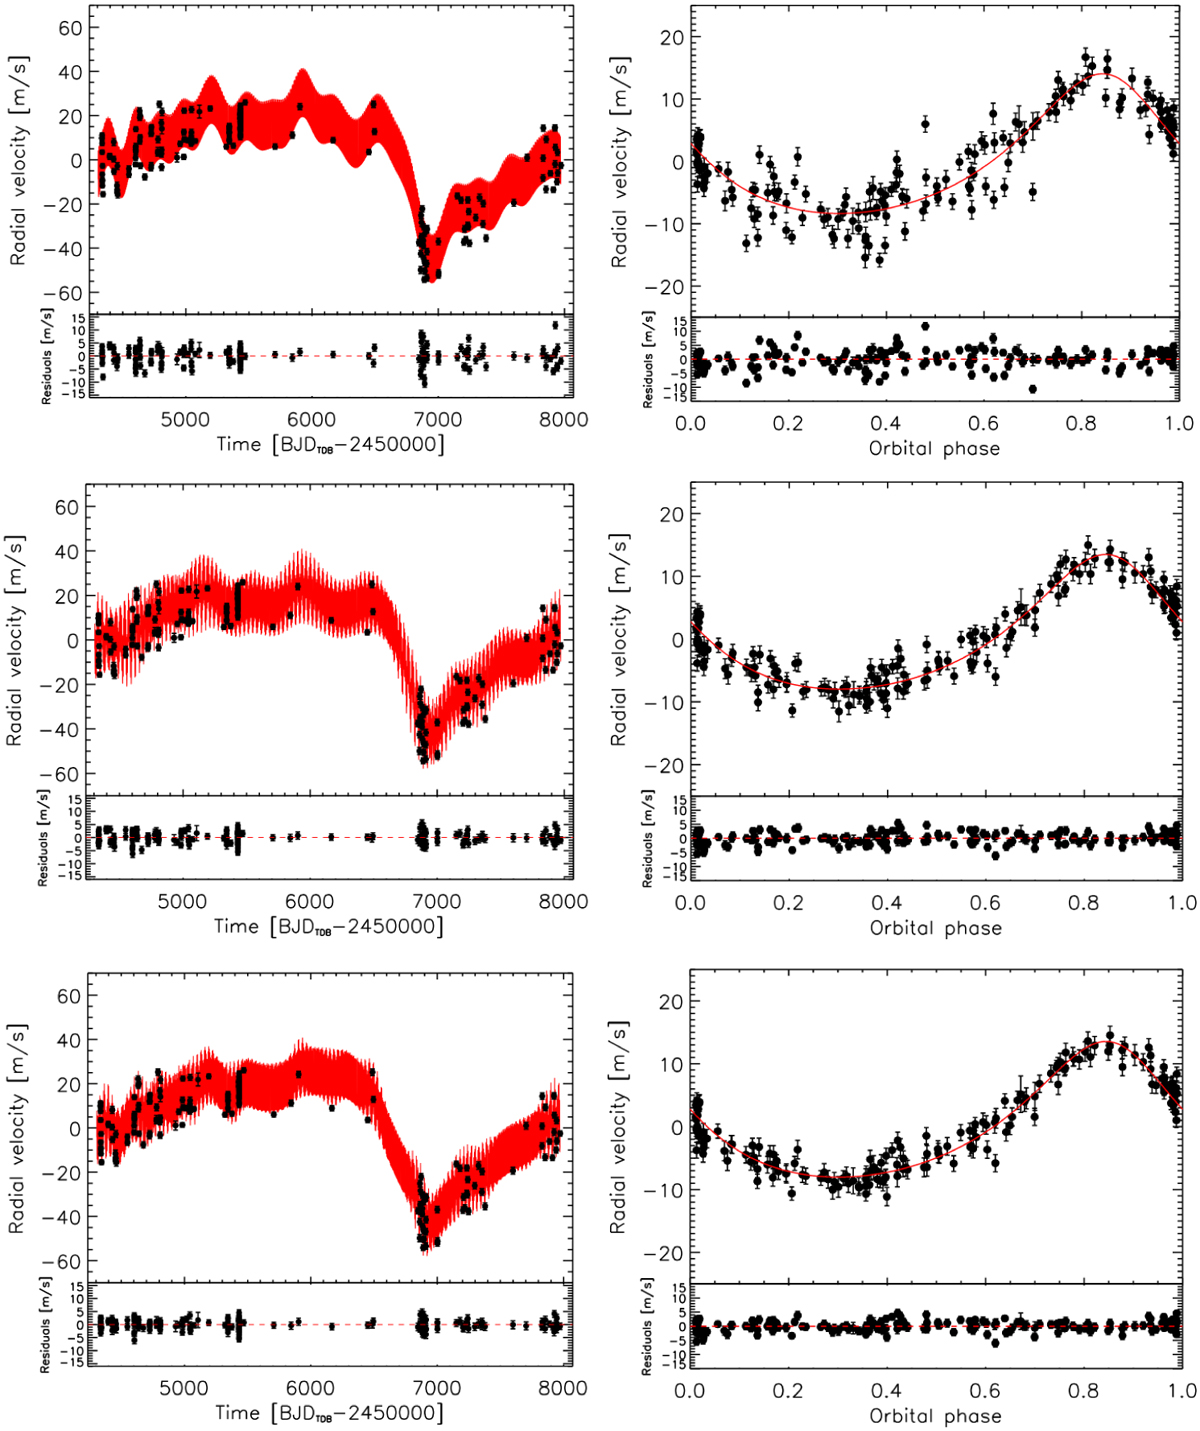
Radial-velocity data analysis. Left panels: HIRES radial velocities of HAT-P-11 (black circles) showing a clear long-term trend likely due to the stellar magnetic activity cycle. The best-fit models including both the Keplerian signal of HAT-P-11 b and Gaussian-process regression with squared-exponential (top; Eq. (3)), quasi-periodic (middle; Eq. (4)), and quasi-periodic+squared-exponential (bottom; Eq. (5)) kernels are indicated with red solid lines. Right panels: HAT-P-11 RVs (black circles) phase-folded with the transit ephemeris of HAT-P-11 b, after removing the long-term trends modelled with Gaussian processes and the same kernels as in the corresponding left panels. The Keplerian eccentric model is displayed with a red solid line. We note the smaller and smaller scatter in the residuals as we move from top (SE kernel) to bottom (QP+SE kernel).
Current usage metrics show cumulative count of Article Views (full-text article views including HTML views, PDF and ePub downloads, according to the available data) and Abstracts Views on Vision4Press platform.
Data correspond to usage on the plateform after 2015. The current usage metrics is available 48-96 hours after online publication and is updated daily on week days.
Initial download of the metrics may take a while.