Fig. 6
Download original image
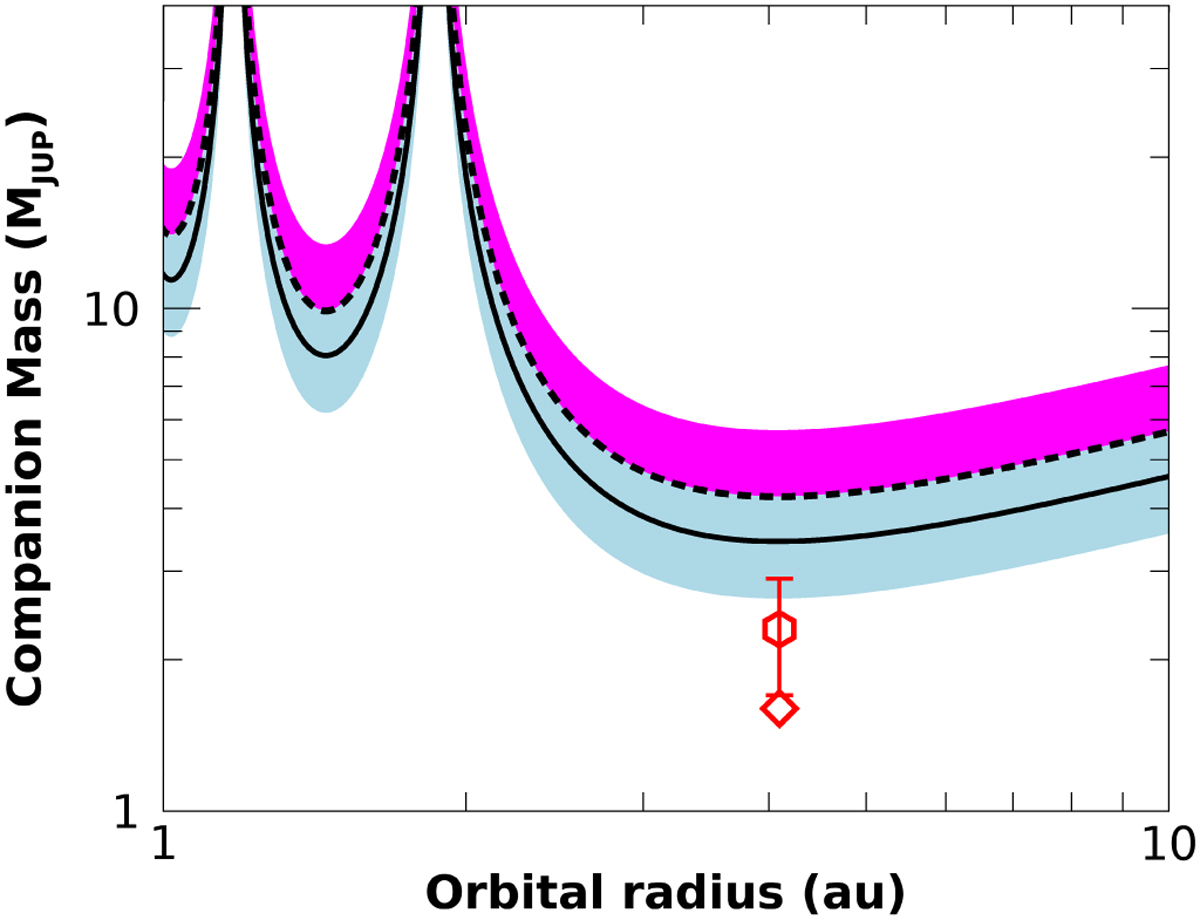
Sensitivity of the PMA technique to companions of given mass and orbital separation orbiting HAT-P-11. The black long-dashed and solid curves correspond to the combinations of mass and orbital radius explaining the PMA values at the mean Gaia DR2 and DR3 epochs, respectively. The shaded light blue region corresponds to the 1σ uncertainty domain of the DR3 PMA, while the shaded magenta region encompasses the 1 σ uncertainty of the DR2 PMA. The red diamond indicates the separation and minimum mass of the HAT-P-11 c companion proposed by Yee et al. (2018), while the red hexagon corresponds to the true mass value determined by the Xuan & Wyatt (2020) analysis.
Current usage metrics show cumulative count of Article Views (full-text article views including HTML views, PDF and ePub downloads, according to the available data) and Abstracts Views on Vision4Press platform.
Data correspond to usage on the plateform after 2015. The current usage metrics is available 48-96 hours after online publication and is updated daily on week days.
Initial download of the metrics may take a while.