Fig. 5
Download original image
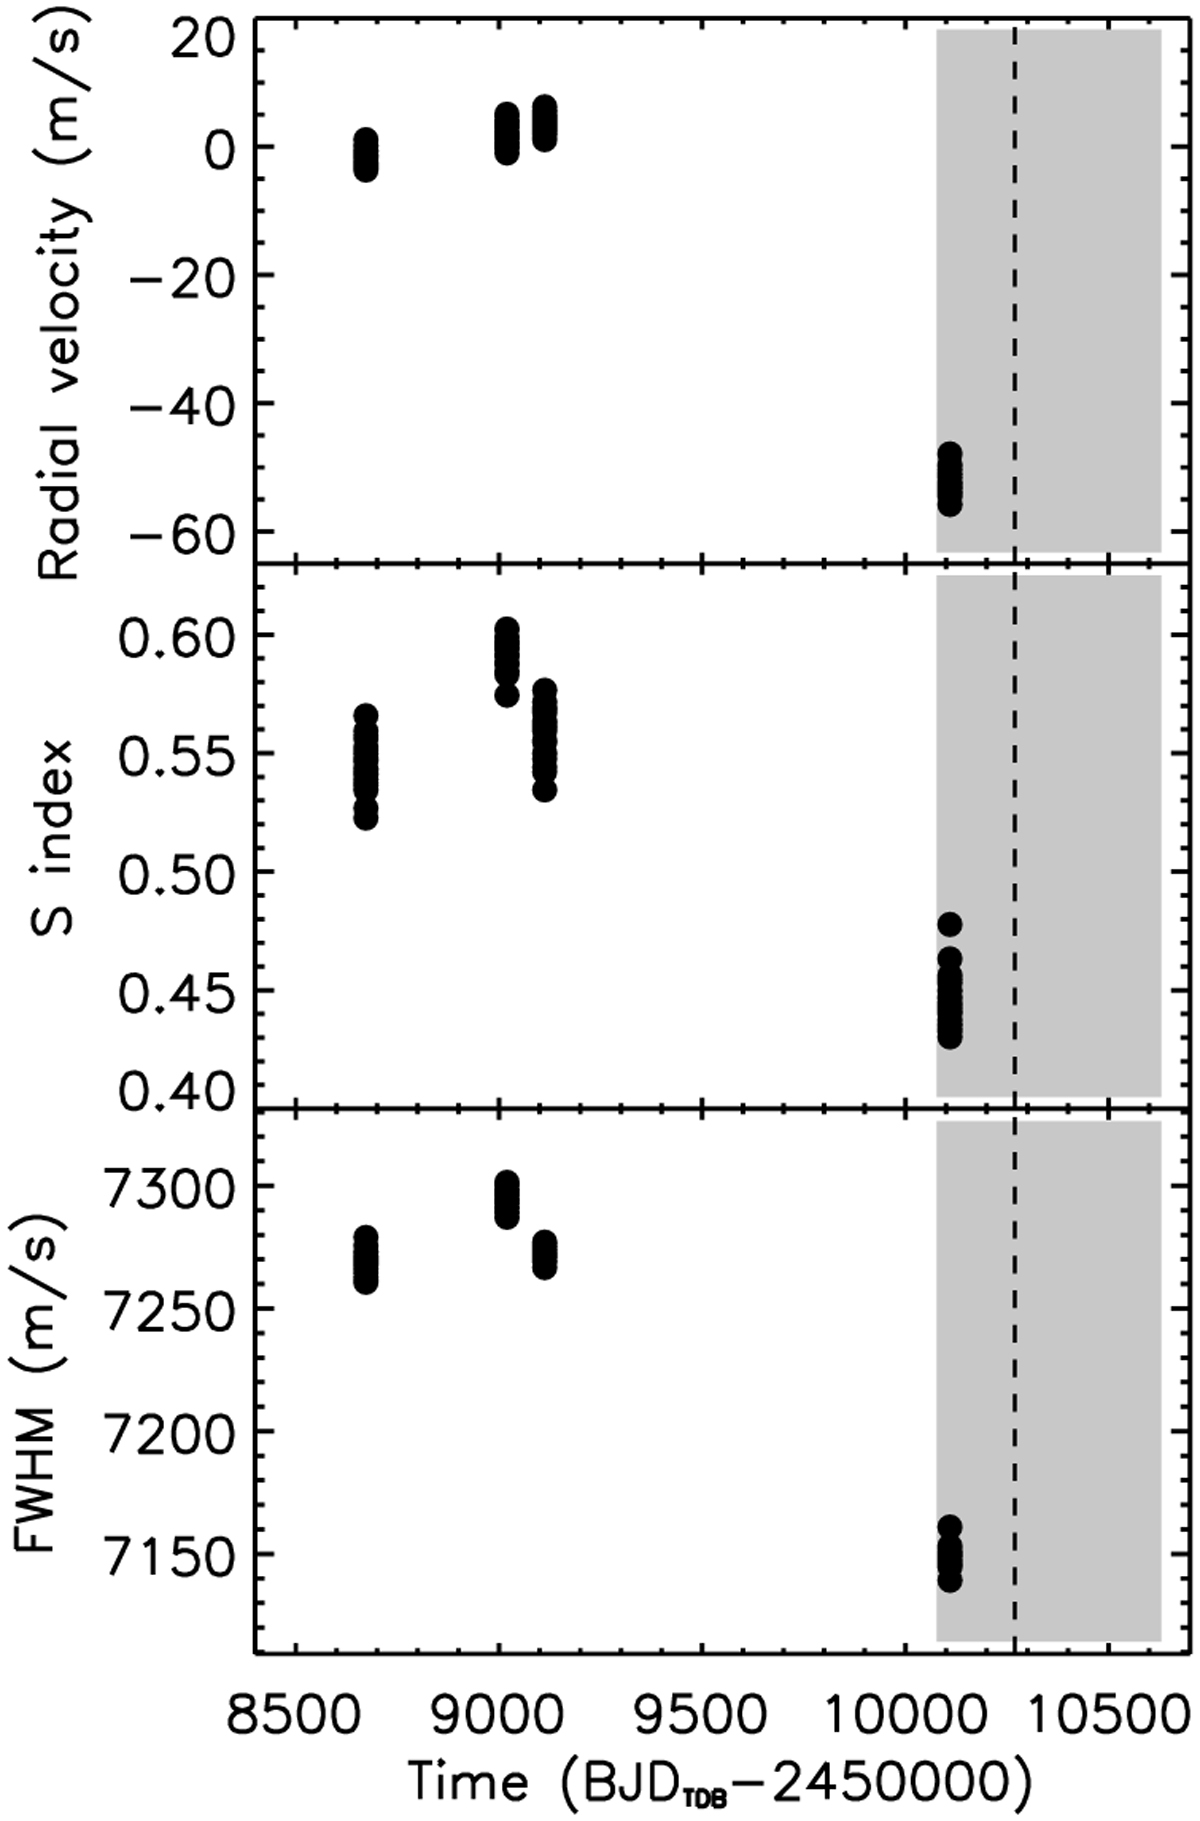
HARPS-N RV (top panel), Call S-index (middle panel), and FWHM (bottom panel) measurements of HAT-P-11 during the four HAT-P-11 b transit nights for atmospheric characterisation. The three time series are highly correlated showing the same long-term trend, with no apparent shifts in the minima of variations. The vertical dashed line indicates the predicted periastron time of the hypothetical planet c, and the grey area shows its 1σ error bar accounting for the uncertainty on the orbital period from Yee et al. (2018). Note: The HARPS-N radial velocities were divided by their median of −63420.4 m s−1, to make a straightforward comparison with the HIRES radial velocities in Fig. 4.
Current usage metrics show cumulative count of Article Views (full-text article views including HTML views, PDF and ePub downloads, according to the available data) and Abstracts Views on Vision4Press platform.
Data correspond to usage on the plateform after 2015. The current usage metrics is available 48-96 hours after online publication and is updated daily on week days.
Initial download of the metrics may take a while.