Fig. E.2
Download original image
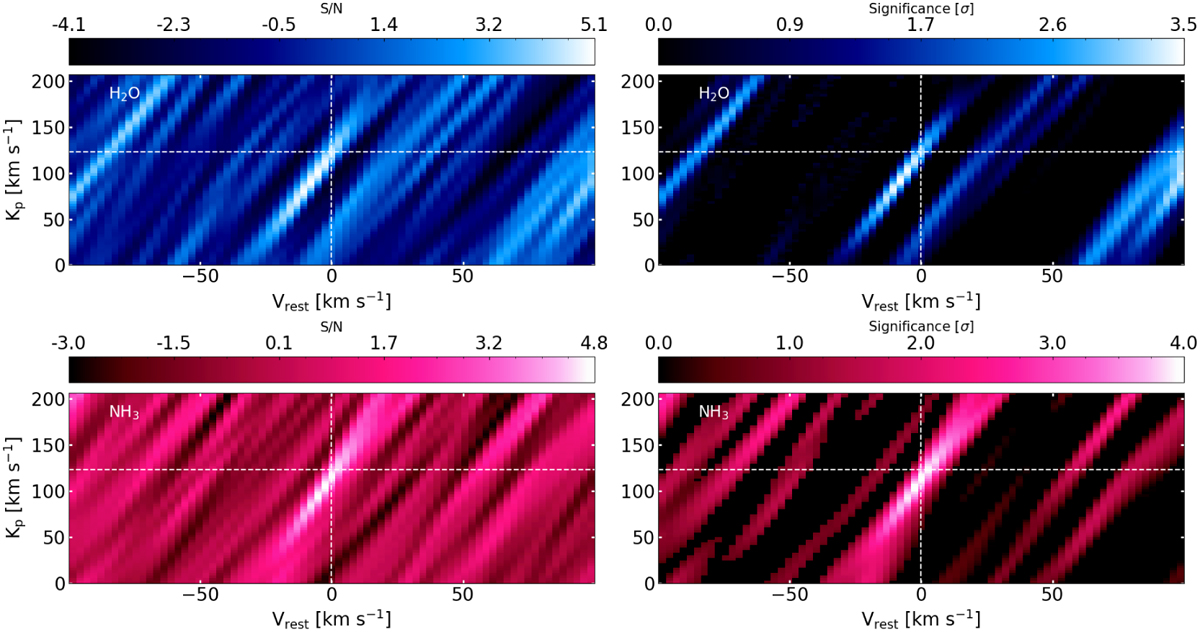
Signal-to-noise ratio (left panels) and Welch t-test significance (right panels) Kp – Vrest maps for the 2 tested chemical species (top for H2O, bottom for NH3) obtained by combining data from the four observing nights excluding spectral orders with ΔS/N < 2 σ. The point where the 2 white dashed lines cross each other is the expected position of a signal with planetary origin.
Current usage metrics show cumulative count of Article Views (full-text article views including HTML views, PDF and ePub downloads, according to the available data) and Abstracts Views on Vision4Press platform.
Data correspond to usage on the plateform after 2015. The current usage metrics is available 48-96 hours after online publication and is updated daily on week days.
Initial download of the metrics may take a while.