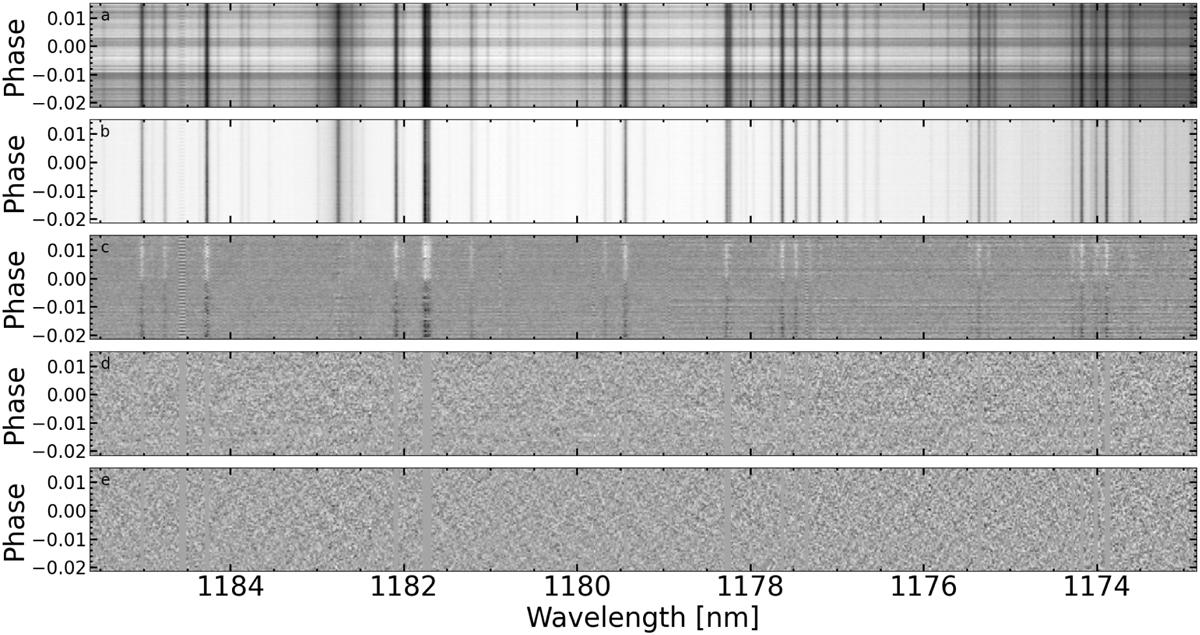
Fig. A.1
Download original image
Example of the stages of the GIANO-B data reduction process applied to real GIANO-B spectra over a short wavelength interval (x-axis). The planetary orbital phase is reported on the y-axis. From top to bottom panel: (a) the extracted spectra; (b) residual spectra after having normalised each spectrum (each row) by its median value to correct baseline flux differences between the spectra that are due, for example, to variable transparency of the atmosphere, imperfect telescope pointing, or instability of the stellar point spread function; (c) residuals after each spectral channel (each column) had its mean subtracted; (d) residuals after having masked the strongest or saturated telluric lines and having removed the telluric and stellar spectra with the PCA; as it can be seen also other spurious effects such as the alternating pattern visible at certain wavelengths likely related to the instrument A-B nodding are effectively removed with PCA; (e) residuals after having applied a high-pass filter to each row of the residual matrix (this step mitigates any residual correlation between different spectral channels).
Current usage metrics show cumulative count of Article Views (full-text article views including HTML views, PDF and ePub downloads, according to the available data) and Abstracts Views on Vision4Press platform.
Data correspond to usage on the plateform after 2015. The current usage metrics is available 48-96 hours after online publication and is updated daily on week days.
Initial download of the metrics may take a while.