Fig. 12
Download original image
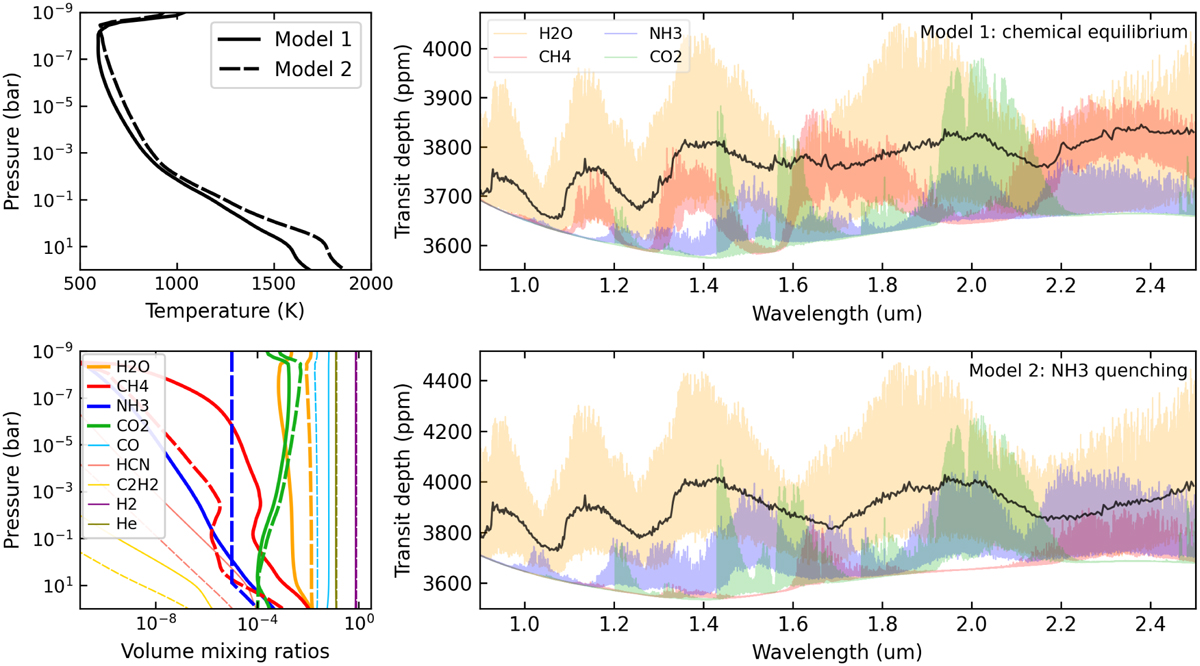
Most favourable atmospheric chemical models. Top-left panel: HAT-P-11 b atmospheric temperature-pressure profile corresponding to the most favourable chemical-equilibrium model that shows spectral features from all the detected species, including the tentatively detected ones (Model 1: [M/H]=2.0, C/O=0.9, N/O=0.85, βirr=0.5; solid line) and to a grid model modified including NH3 vertical quenching at the 10 bar level (Model 2: [M/H]=1.7, C/O=0.59, N/O=0.14, βirr=0.5; dashed line). Bottom-left panel: volume mixing ratios of the dominant chemical species (see legend) as a function of the atmospheric pressure corresponding to Model 1 (solid lines) and to Model 2 (dashed lines). Right panels: theoretical transmission spectra of HAT-P-11 b for atmospheres in thermochemical equilibrium (top-right panel) and with NH3 quenching (bottom-right panel). The coloured curves show the contribution to the synthetic spectra of the four species detected by GIANO-B, including the tentatively detected ones (see legend). The black curve shows a lower-resolution (R = 500) spectrum combining the absorption from all atmospheric species in the model.
Current usage metrics show cumulative count of Article Views (full-text article views including HTML views, PDF and ePub downloads, according to the available data) and Abstracts Views on Vision4Press platform.
Data correspond to usage on the plateform after 2015. The current usage metrics is available 48-96 hours after online publication and is updated daily on week days.
Initial download of the metrics may take a while.