Fig. 11
Download original image
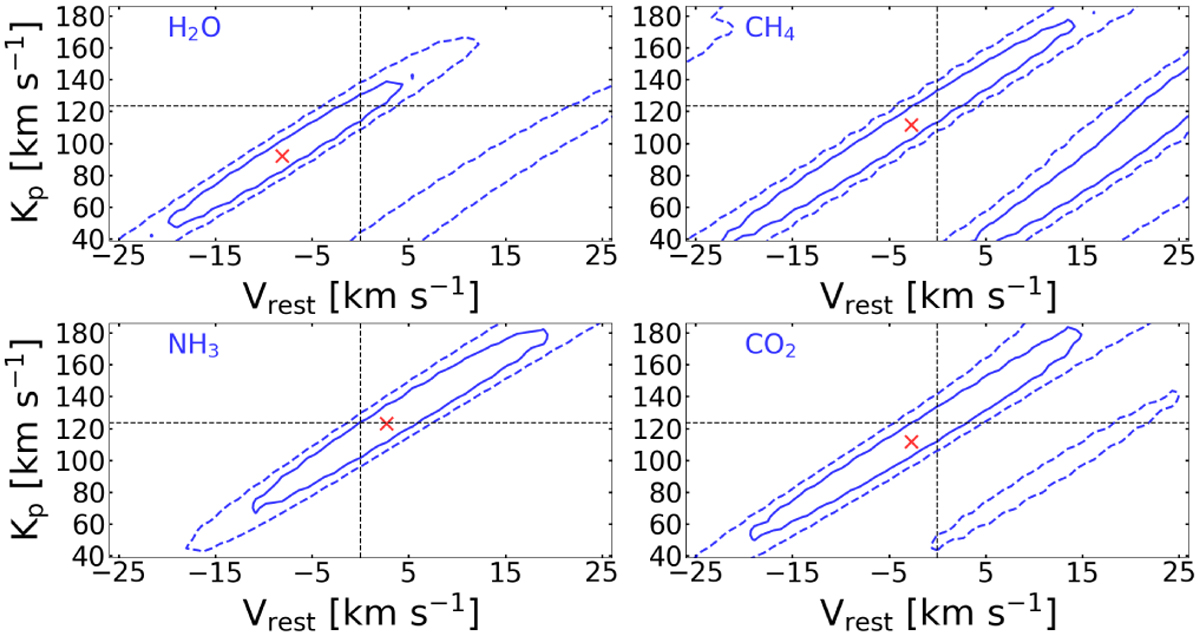
Contour plots of the detection significance of the four selected chemical species. The solid (dashed) lines represent the 1 σ (2 σ) interval around the peak value of the significance (marked with a red cross). These intervals are computed as described in the text. The point of the Kp – Vrest map in which the 2 black dashed lines (the horizontal one corresponds to the expected Kp value, while the vertical one corresponds to Vrest = 0 km s−1) cross each other represents the expected detection significance peak position in the case in which the detected signal has a planetary origin. As it can be the significance peak position is compatible with the planetary origin hypothesis at better than 1 σ for all the 4 species.
Current usage metrics show cumulative count of Article Views (full-text article views including HTML views, PDF and ePub downloads, according to the available data) and Abstracts Views on Vision4Press platform.
Data correspond to usage on the plateform after 2015. The current usage metrics is available 48-96 hours after online publication and is updated daily on week days.
Initial download of the metrics may take a while.