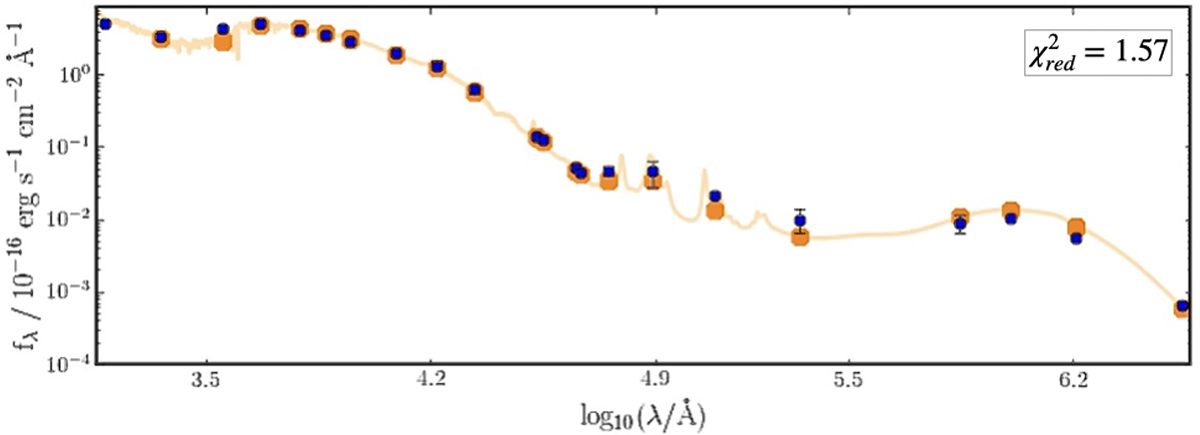
Fig. A.1.
Download original image
BAGPIPES SED-fitting plot for an aperture located in the centre of NGC4321 (aperture A in 1). The data are shown in blue, and the posterior distribution, given by the difference of the 16th and the 84th percentiles, is shown in orange. The error bars are reported for the observed data. When they not visible, they are smaller than the corresponding symbols.
Current usage metrics show cumulative count of Article Views (full-text article views including HTML views, PDF and ePub downloads, according to the available data) and Abstracts Views on Vision4Press platform.
Data correspond to usage on the plateform after 2015. The current usage metrics is available 48-96 hours after online publication and is updated daily on week days.
Initial download of the metrics may take a while.