Fig. 9
Download original image
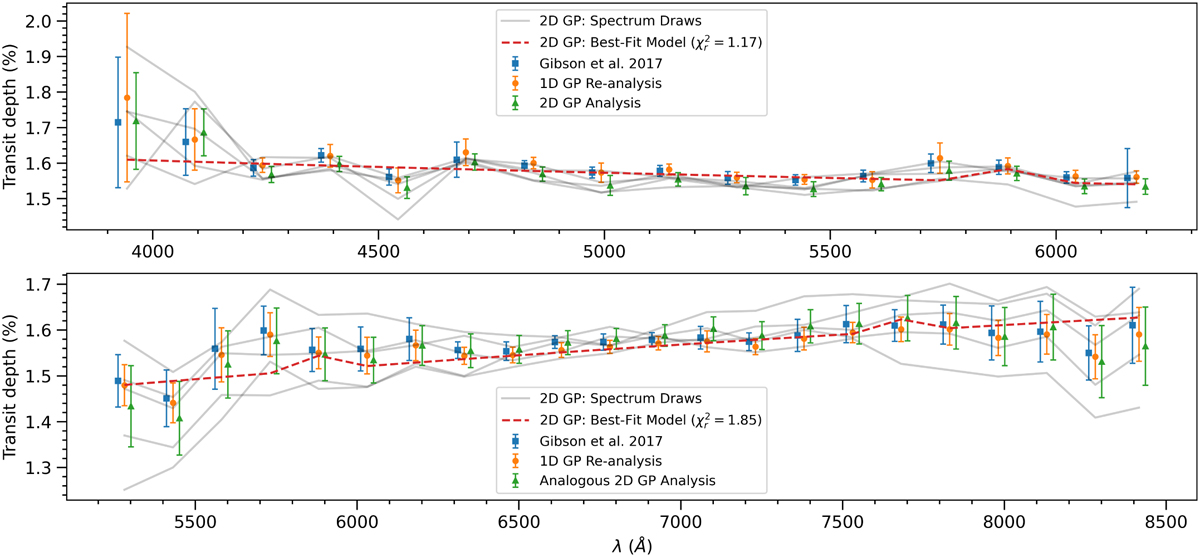
600B (top) and 600RI (bottom) retrieved transmission spectra comparing original analysis, 1D GP re-analysis and analogous 2D GP analysis. The 2D GP best-fit atmospheric retrieval is shown as a red dotted line and random draws taken from the 2D GP spectrum are shown in grey. Top: all three analyses show largely consistent results. Bottom: the error bars of each method may appear consistent but the random draws from the 2D GP spectrum demonstrates a large uncertainty in the slope of this spectrum after accounting for the covariance between transit depths.
Current usage metrics show cumulative count of Article Views (full-text article views including HTML views, PDF and ePub downloads, according to the available data) and Abstracts Views on Vision4Press platform.
Data correspond to usage on the plateform after 2015. The current usage metrics is available 48-96 hours after online publication and is updated daily on week days.
Initial download of the metrics may take a while.