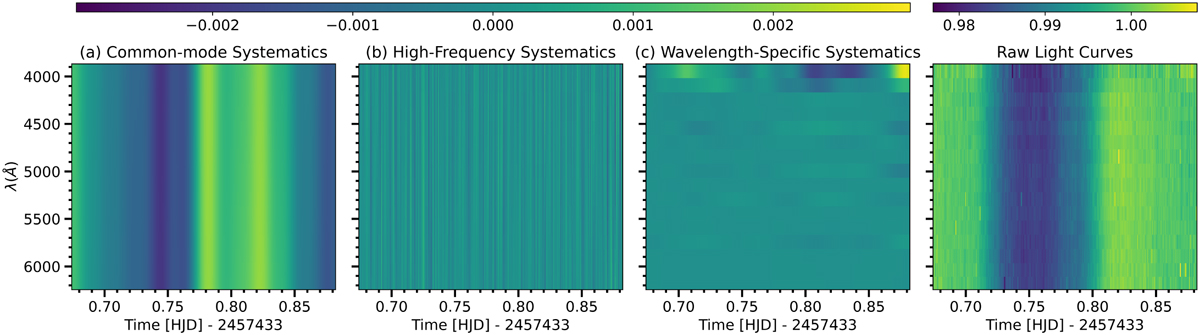
Fig. 8
Download original image
Plots showing GP predictive means fit by 2D GP in 600B dataset to account for (in order from left to right): (a) common-mode systematics, (b) high-frequency systematics and (c) wavelength-specific systematics. The rightmost plot is the raw light curves included for reference. Specifically, the middle plots show the change in the GP mean caused by including these systematics in the fit, as discussed in Sec. 4.2.
Current usage metrics show cumulative count of Article Views (full-text article views including HTML views, PDF and ePub downloads, according to the available data) and Abstracts Views on Vision4Press platform.
Data correspond to usage on the plateform after 2015. The current usage metrics is available 48-96 hours after online publication and is updated daily on week days.
Initial download of the metrics may take a while.