Fig. 7
Download original image
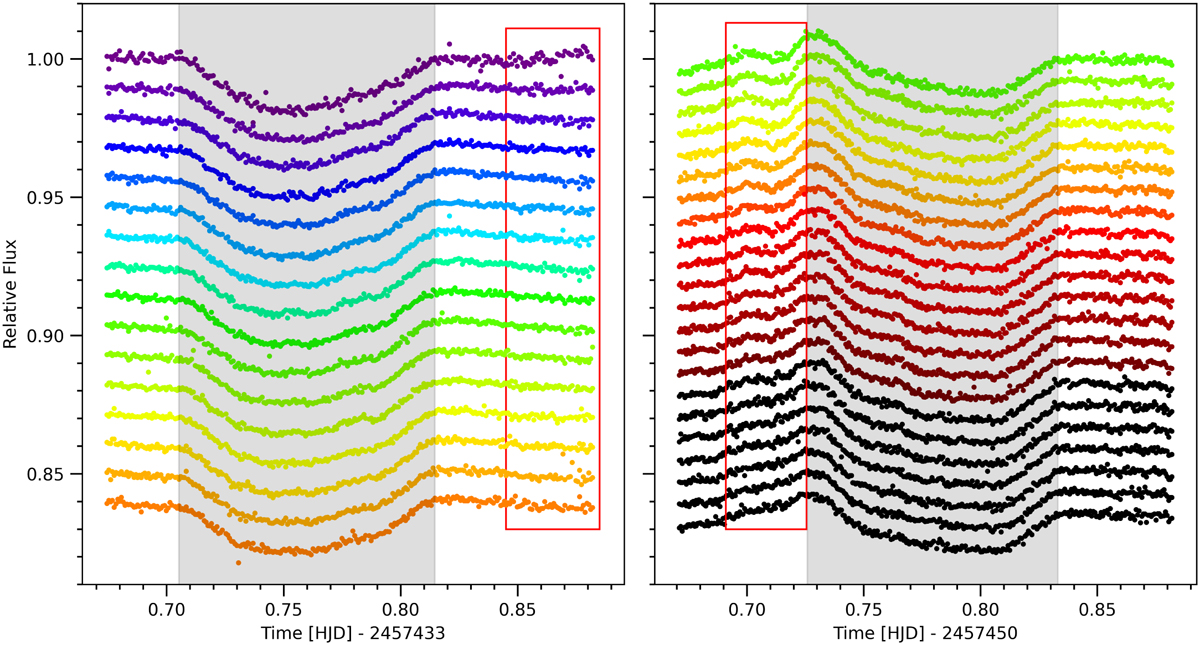
600B grism (left) and 600RI grism (right) spectroscopic light curves with best-fit transit region shaded in grey. Left: the light curves appear to have very similar systematics with the exception of the top one or two light curves in which the region in the red box shows a small increase in flux at the end of the observation. This could suggest the presence of wavelength-specific systematics (WSS) in these data. Right: The slowly varying shape of the systematics – as highlighted in the red box – suggest that the ‘common-mode’ systematics are not actually common-mode but gradually vary in wavelength.
Current usage metrics show cumulative count of Article Views (full-text article views including HTML views, PDF and ePub downloads, according to the available data) and Abstracts Views on Vision4Press platform.
Data correspond to usage on the plateform after 2015. The current usage metrics is available 48-96 hours after online publication and is updated daily on week days.
Initial download of the metrics may take a while.