Fig. 5
Download original image
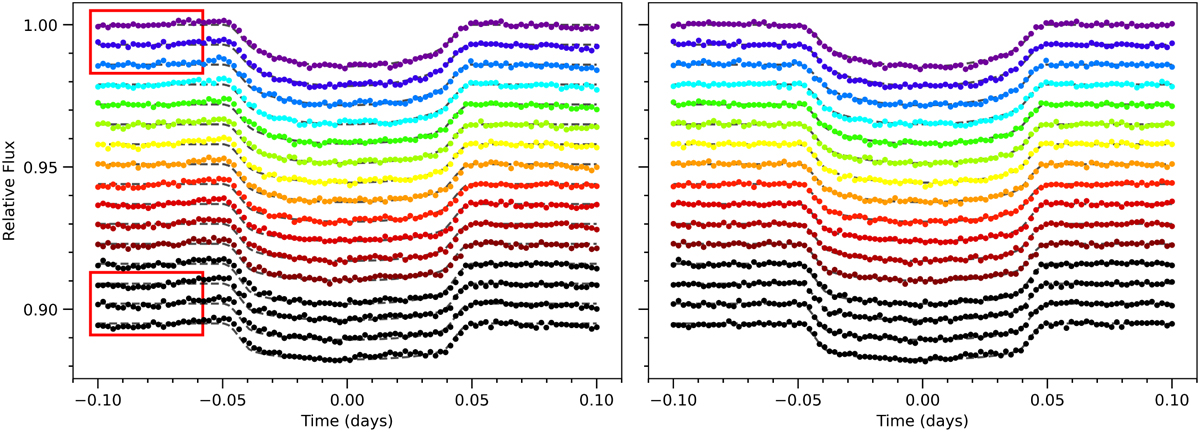
Raw light curves (left) and common-mode corrected light curves (right) for one simulated dataset in Simulation 3 (containing wavelength-correlated systematics). The injected transit signal is plotted as a black dotted line. The variation of the systematics in wavelength is not obvious by eye but can be noticed by comparing the regions highlighted in red boxes. Despite the systematics varying in wavelength, the common-mode correction appears to remove visual signs of systematics.
Current usage metrics show cumulative count of Article Views (full-text article views including HTML views, PDF and ePub downloads, according to the available data) and Abstracts Views on Vision4Press platform.
Data correspond to usage on the plateform after 2015. The current usage metrics is available 48-96 hours after online publication and is updated daily on week days.
Initial download of the metrics may take a while.