Fig. 2
Download original image
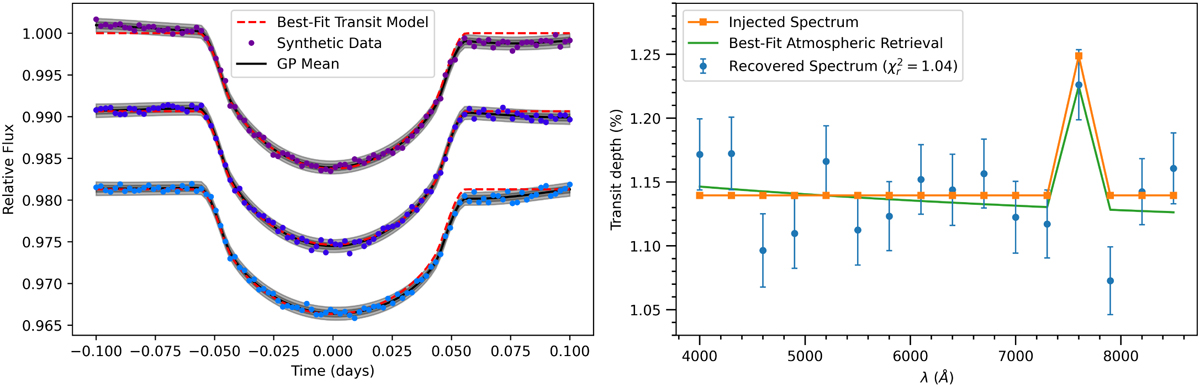
Example of synthetic dataset analysed in Simulation 1 (containing wavelength-independent systematics) showing some simulated light curves (left) and recovered transmission spectrum (right). Left: the three shortest wavelength light curves in the dataset being fit by the transit model combined with a 2D GP noise model (the other 13 light curves were simultaneously fit but not plotted). Right: resulting transmission spectrum from the joint fit of all 16 light curves, with the three leftmost points corresponding to the light curves in the left plot. The recovered transmission spectrum was consistent with the injected spectrum (![]() ). An atmospheric retrieval was performed on the recovered transmission spectrum (with the best-fit model plotted) and was consistent with the flat slope and strong K feature of the injected spectrum.
). An atmospheric retrieval was performed on the recovered transmission spectrum (with the best-fit model plotted) and was consistent with the flat slope and strong K feature of the injected spectrum.
Current usage metrics show cumulative count of Article Views (full-text article views including HTML views, PDF and ePub downloads, according to the available data) and Abstracts Views on Vision4Press platform.
Data correspond to usage on the plateform after 2015. The current usage metrics is available 48-96 hours after online publication and is updated daily on week days.
Initial download of the metrics may take a while.