Fig. L.3
Download original image
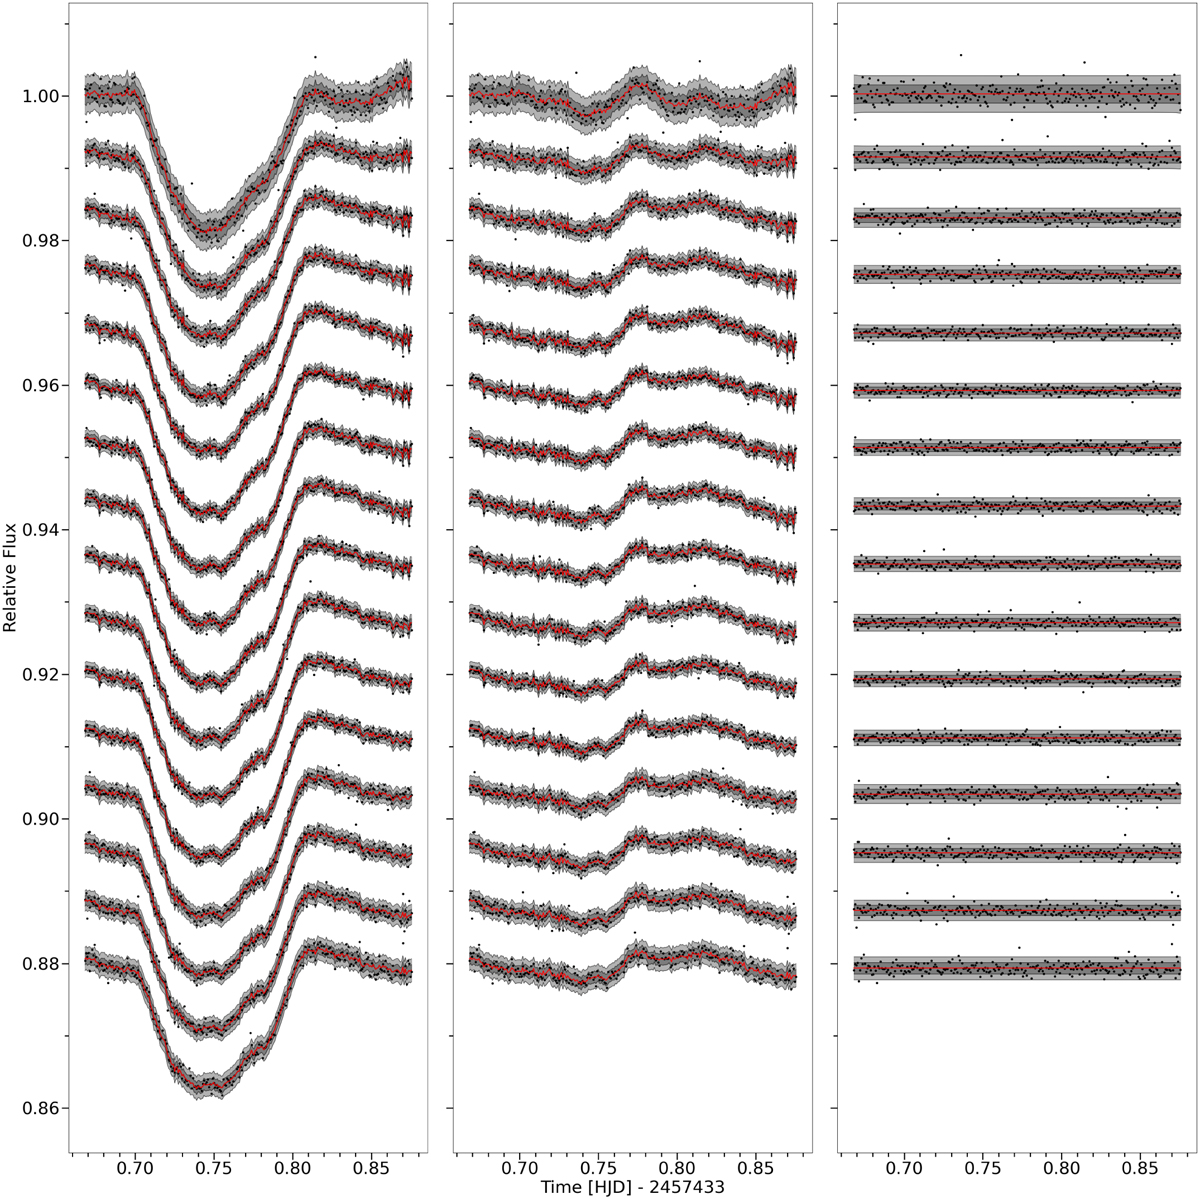
Fitted transit light curves for 600B data, showing GP predictive mean in red as well as 1σ and 2σ uncertainty in mean shaded in grey. Left: Fitting the raw light curves. Middle: The same fit minus the best-fit transit model, displaying just the GP fit to the systematics. Right: The same fit minus both the best-fit transit model and the GP mean (fitting the systematics) subtracted, showing the residual white noise.
Current usage metrics show cumulative count of Article Views (full-text article views including HTML views, PDF and ePub downloads, according to the available data) and Abstracts Views on Vision4Press platform.
Data correspond to usage on the plateform after 2015. The current usage metrics is available 48-96 hours after online publication and is updated daily on week days.
Initial download of the metrics may take a while.