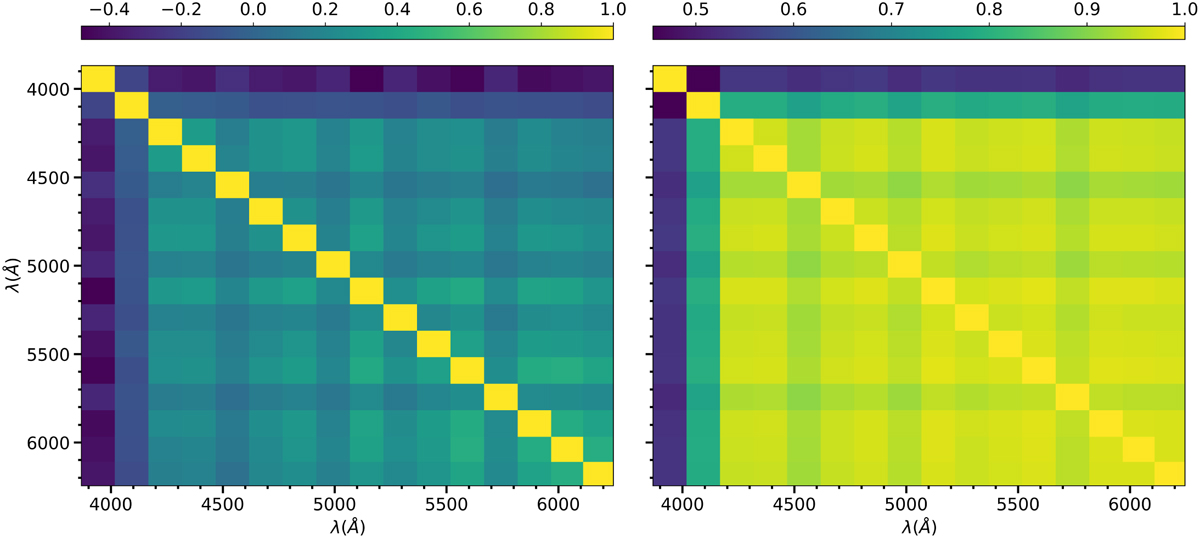
Fig. L.1
Download original image
Heat map of correlation matrices of transmission spectra for 600B data. Left: From the analogous 2D GP analysis, visualising how the uncertainty in each transit depth is correlated across the spectrum. Right: For the 2D GP analysis with no added prior on the mean radius (from Sect. 4.4.2). In both plots, the strength of correlation is not significantly affected by the wavelength separation between light curves for most wavelengths. The right plot in particular shows significant correlations that are mostly independent of wavelength-separation, consistent with significant uncertainty in the offset of the transmission spectrum as all wavelengths are approximately affected equally.
Current usage metrics show cumulative count of Article Views (full-text article views including HTML views, PDF and ePub downloads, according to the available data) and Abstracts Views on Vision4Press platform.
Data correspond to usage on the plateform after 2015. The current usage metrics is available 48-96 hours after online publication and is updated daily on week days.
Initial download of the metrics may take a while.