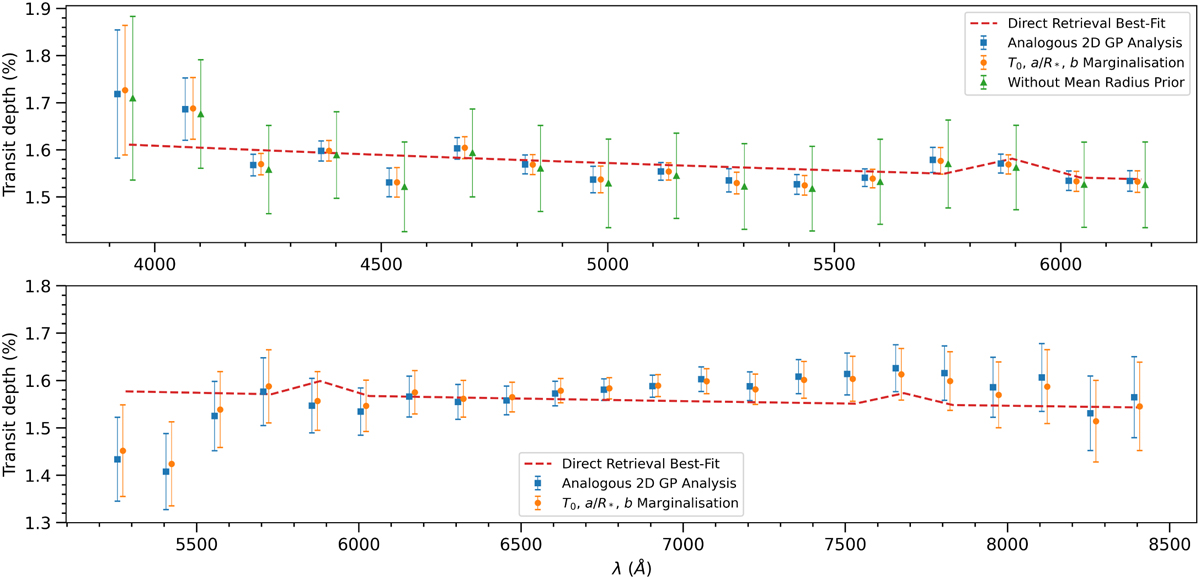
Fig. 10
Download original image
Similar to Fig. 9 but showing different 2D GP analyses tested. As error bars do not convey the correlations between the data points, it is difficult to see that the 600B fit with no mean radius prior – which appears to have much larger uncertainties – actually has a similar constraint on the slope and Na feature compared to the other methods. For the direct retrieval of atmospheric parameters from the data, a dotted line is included that shows the best-fit atmospheric model (as the transmission spectrum is not directly retrieved with this method).
Current usage metrics show cumulative count of Article Views (full-text article views including HTML views, PDF and ePub downloads, according to the available data) and Abstracts Views on Vision4Press platform.
Data correspond to usage on the plateform after 2015. The current usage metrics is available 48-96 hours after online publication and is updated daily on week days.
Initial download of the metrics may take a while.