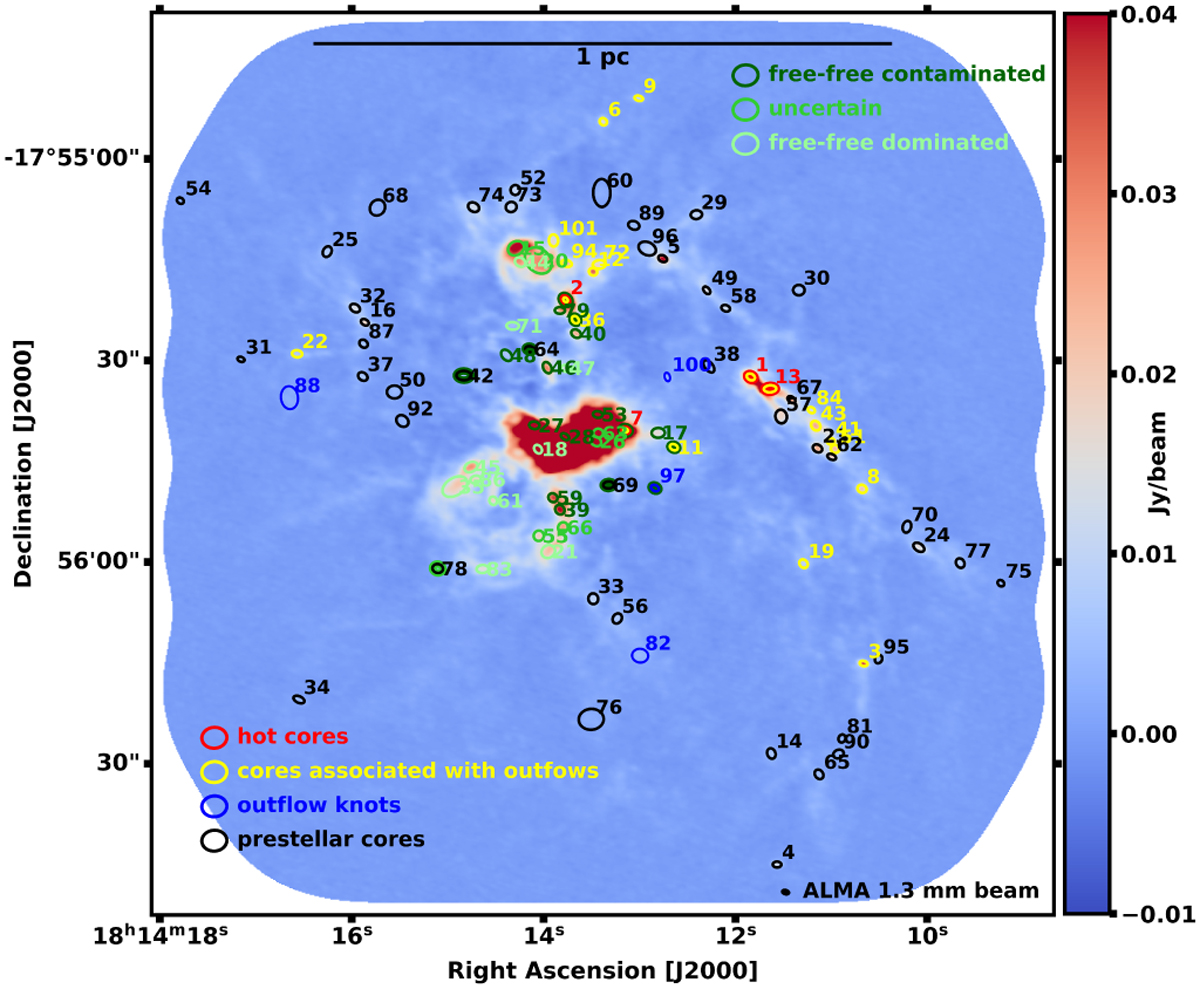
Fig. 9
Download original image
bsens continuum map at 1.3 mm obtained with ALMA, with cores from the getsf filtered core catalogue. The colours now represent the different categories of cores that we identified: free-free contaminated cores in dark green, free-free dominated cores in light green, and ‘uncertain’ cores (see Sect. 4.2) in neutral green. Outflow knots/CO-contaminated cores (see Sect. 4.3) are shown in blue, hot core candidates (see Sect. 5.1) in red, cores associated with outflows (see Sect. 5.2) in yellow, and the remaining prestellar cores in black, following scenario A (see text, Sect. 5.2).
Current usage metrics show cumulative count of Article Views (full-text article views including HTML views, PDF and ePub downloads, according to the available data) and Abstracts Views on Vision4Press platform.
Data correspond to usage on the plateform after 2015. The current usage metrics is available 48-96 hours after online publication and is updated daily on week days.
Initial download of the metrics may take a while.