Fig. 8
Download original image
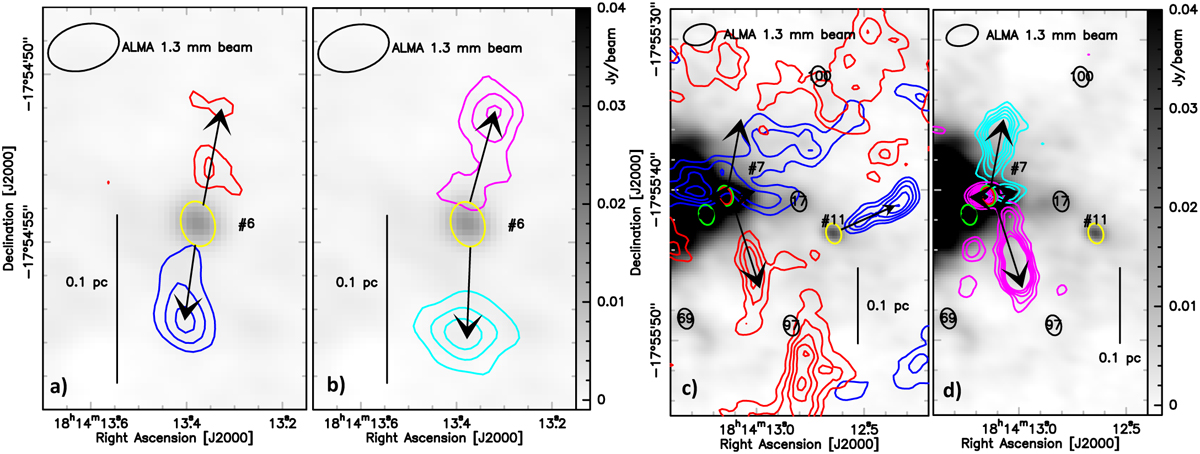
bsens continuum map at 1.3 mm with coloured contours of moment 0 of 12CO (2–1) in red and blue (panels a and c) and SiO(5–4) in magenta and cyan (panels b and d). For all four panels, the synthesised beams are presented in the upper left corners and a 0.1 pc scale-bar is shown. Blue (cyan) and red (magenta) correspond to integration between, respectively, [12; 32] km s−1 and [42; 62] km s−1 for the two molecules of study. Panels a and c: with 1σ = 0.7 Jy beam−1 km s−1, blue and red contour levels are 4, 6, 8, 10, 12, and 14σ. Panels b and d: 1σ = 0.03 Jy beam−1 km s−1 and the corresponding cyan and magenta contours are 3, 7, 10, 13, 15, and 17σ. In coloured markers, the getsf cores are shown with ellipses: hot core candidates in red (see Sect. 5.1), cores associated with outflows in yellow, free-free contaminated and uncertain ones in green, and prestellar ones in black following scenario A (see text, Sect. 5.2).
Current usage metrics show cumulative count of Article Views (full-text article views including HTML views, PDF and ePub downloads, according to the available data) and Abstracts Views on Vision4Press platform.
Data correspond to usage on the plateform after 2015. The current usage metrics is available 48-96 hours after online publication and is updated daily on week days.
Initial download of the metrics may take a while.