Fig. 7
Download original image
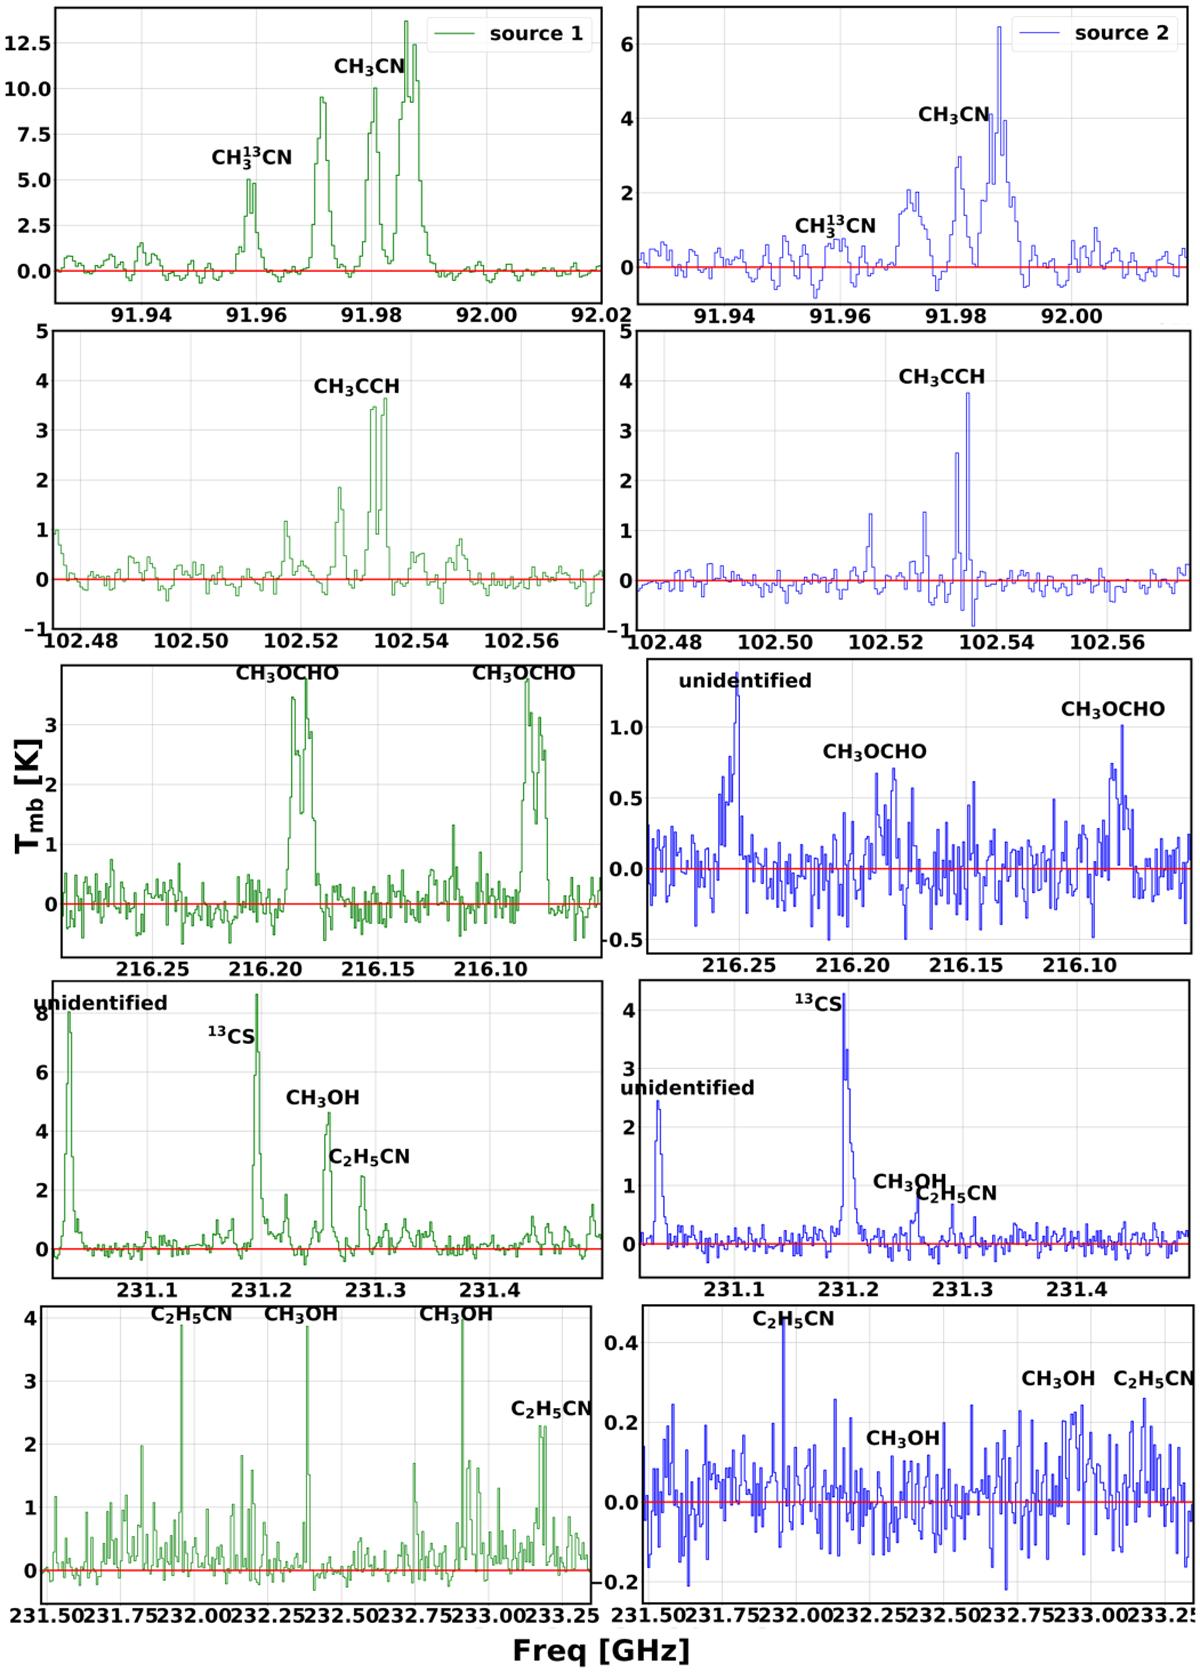
Selected spectra from two hot core candidates, core #1 (left panels) and core #2 (right panels). From top to bottom, spectral windows 1 and 2 of Band 3 are shown, followed by spectral windows 0, 6, and 7 of Band 6. Source #1 is detected with many COMs lines. In all panels, the identified lines are indicated, and the baseline is shown with a red line.
Current usage metrics show cumulative count of Article Views (full-text article views including HTML views, PDF and ePub downloads, according to the available data) and Abstracts Views on Vision4Press platform.
Data correspond to usage on the plateform after 2015. The current usage metrics is available 48-96 hours after online publication and is updated daily on week days.
Initial download of the metrics may take a while.