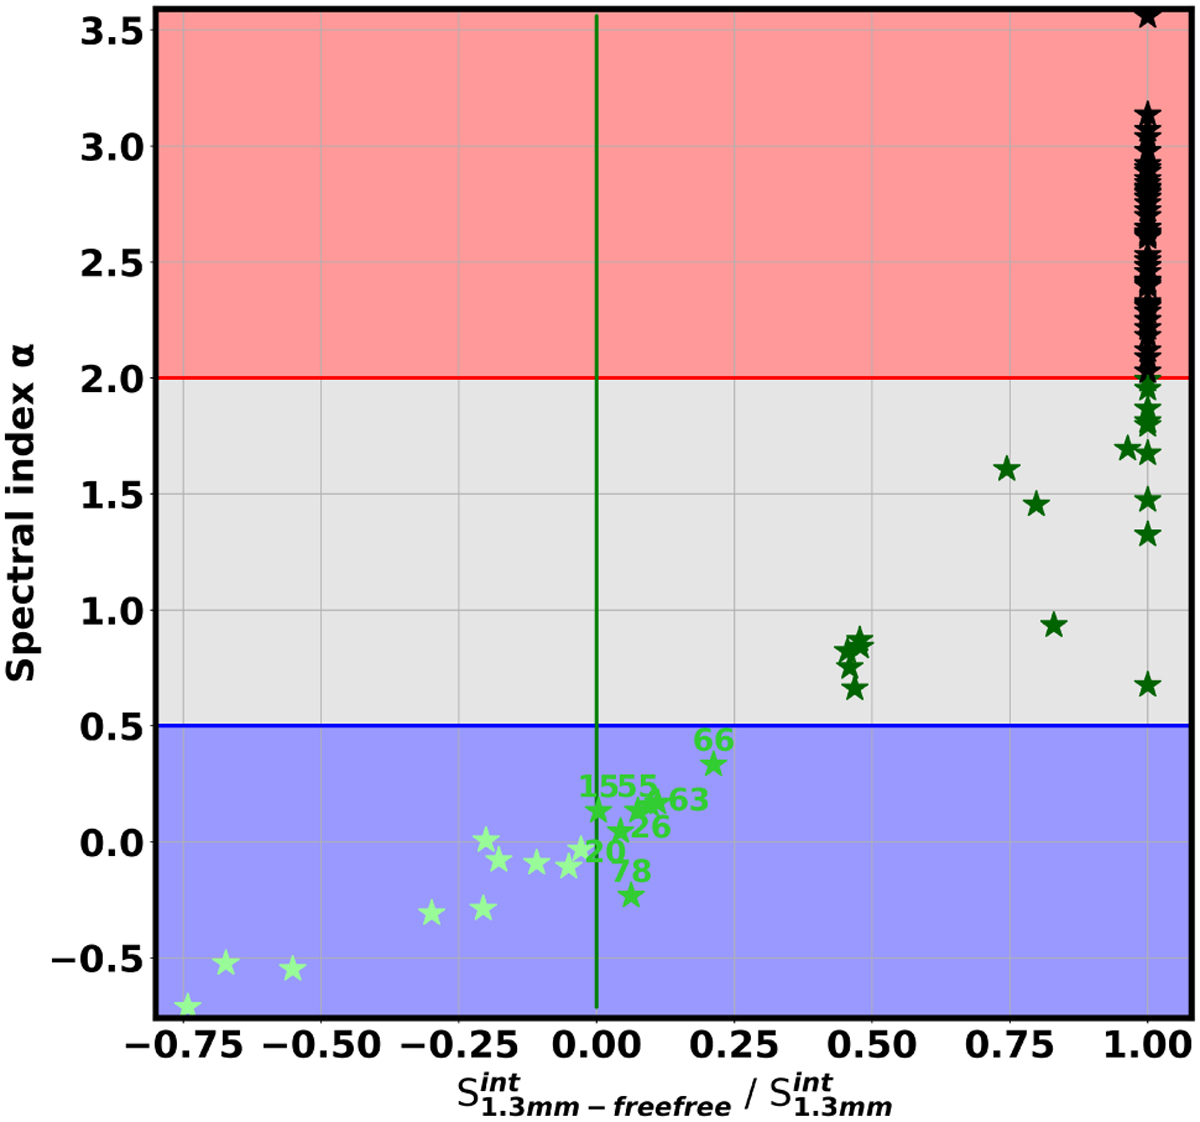
Fig. 6
Download original image
Cross-correlation between spectral index measurements displayed in Fig. 5c (y-axis) and ratio of the flux density from ‘pure’ dust emission over the bsens 1.3 mm flux density at 3 mm angular resolution for each core from the getsf filtered catalogue (x-axis). The x-axis shows the percentage of 1.3 mm emission due to dust emission at 3 mm angular resolution. Free-free contaminated cores are shown in dark green, freefree dominated cores in light green, and ‘uncertain’ ones (see Sec. 4.2) in neutral green, and the rest of the cores are shown in black.
Current usage metrics show cumulative count of Article Views (full-text article views including HTML views, PDF and ePub downloads, according to the available data) and Abstracts Views on Vision4Press platform.
Data correspond to usage on the plateform after 2015. The current usage metrics is available 48-96 hours after online publication and is updated daily on week days.
Initial download of the metrics may take a while.