Fig. 5
Download original image
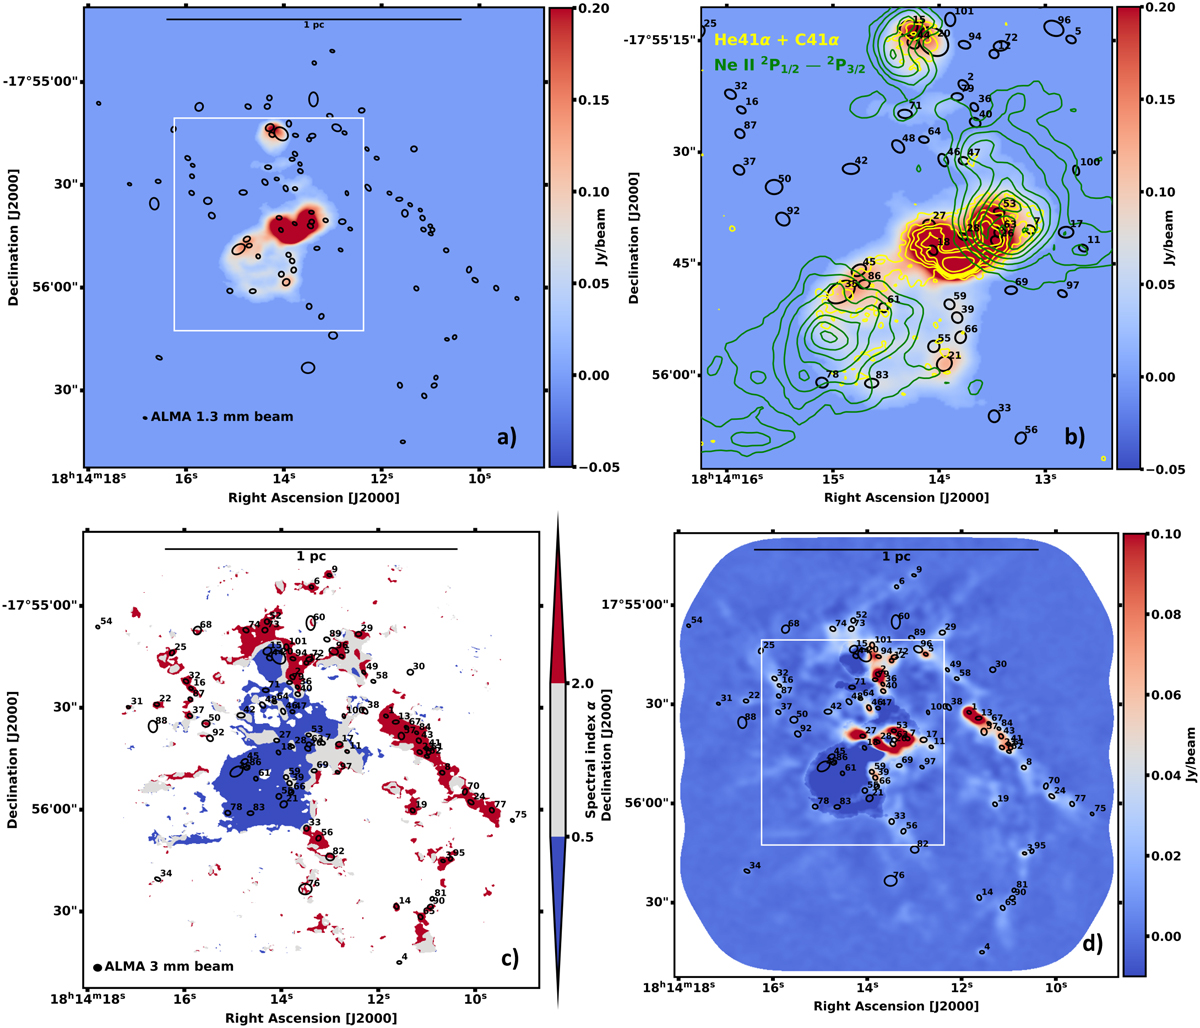
Study of the free-free contamination within W33-Main. Panel a: H41α line emission map at 92.034 GHz integrated between −5.8 and 84.4 km s−1 (see Galván-Madrid et al. 2024), with the sources identified by getsf in black ellipses. Panel b: zoomed-in view of H41α line emission map in white rectangle in panel a. The yellow contours show He41α and C41α lines’ emission maps at 92.072 and 92.080 GHz, respectively, regridded to the bsens 1.3 mm continuum spatial resolution, with contour levels of 3, 6, 9, 13, 16, and 30σ (1σ = 0.064 Jy beam−1). The green contours are the Ne II line emission with contour levels of 1, 2, 3, 4, and 5σ (1σ = 0.01 erg s−1 cm−2 sr−1). Panel c: spectral index α map with the following mask: if α ≤ 0.5 the emission is free-free dominated (in blue), if α ≥ 2 the emission is dust dominated (in red), and in between (0.5≤ α ≤ 2) we call the emission ‘free-free contaminated’ (in grey). Panel d: cleanest continuum map at 1.3 mm from which the free-free estimated contribution at 1.3 mm was removed using the H41α line and assuming an optically thin spectral index (α = 0.1). The resulting emission is equal to or less than zero if it is dominated by free-free emission (dark blue in the map). The map is shown at the 3 mm angular resolution.
Current usage metrics show cumulative count of Article Views (full-text article views including HTML views, PDF and ePub downloads, according to the available data) and Abstracts Views on Vision4Press platform.
Data correspond to usage on the plateform after 2015. The current usage metrics is available 48-96 hours after online publication and is updated daily on week days.
Initial download of the metrics may take a while.