Fig. 4
Download original image
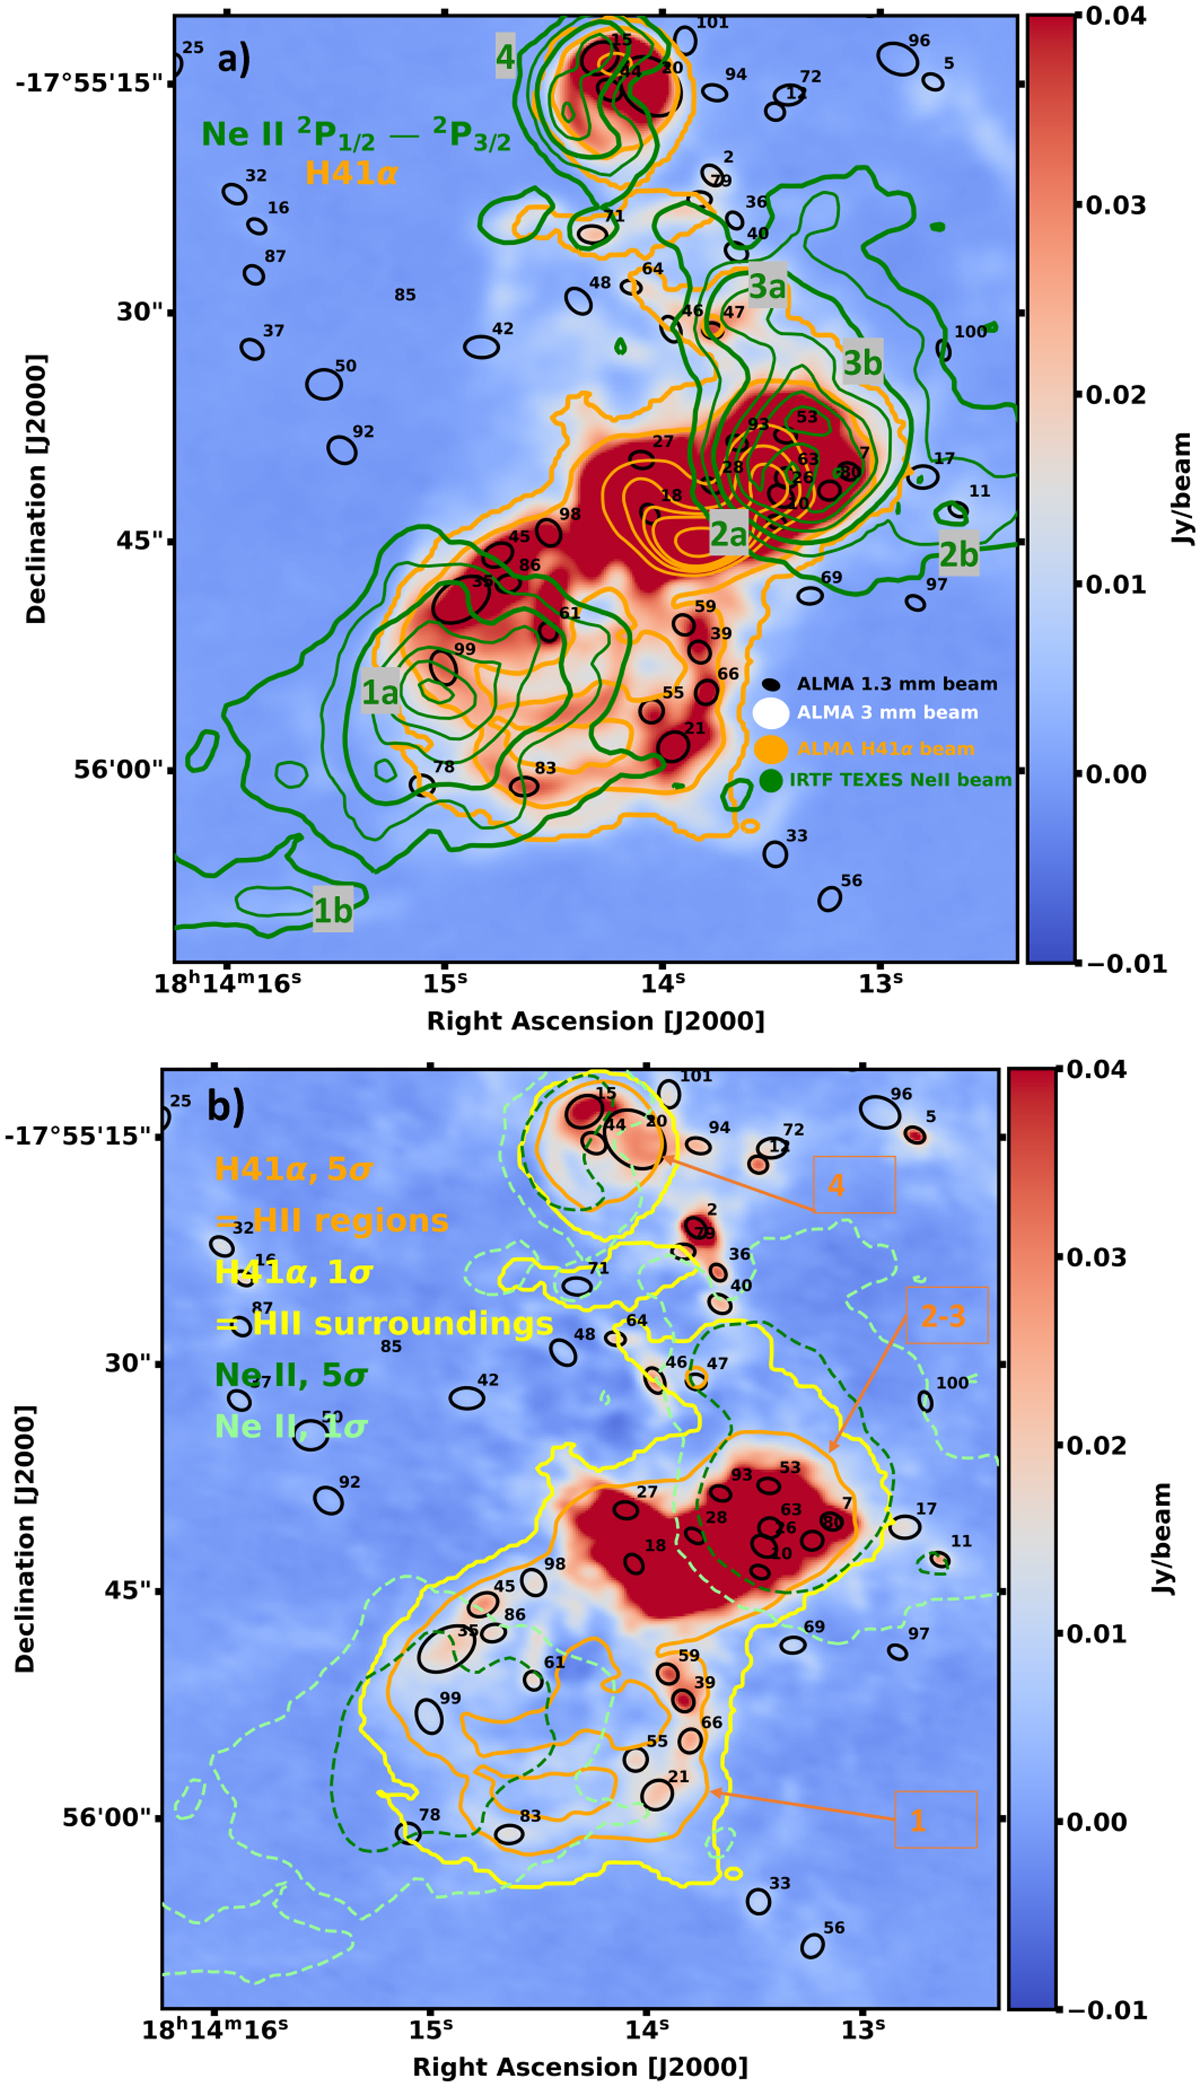
Zoomed-in view of black rectangle shown in Fig. 2. Panel a: bsens continuum map at 3 mm. The orange contours show the H41α line emission (see Galván-Madrid et al. 2024) with levels of 1, 5, 20, 30, 40, 50, and 100σ (1σ = 0.01 Jy beam−1). The green contours are the Ne II line emission with the labels of Beilis et al. (2022). The contour levels are 1, 2, 5, 10, 15, 20, and 25σ (1σ = 0.002 erg s−1 cm−2 sr−1). Panel b: yellow and orange contours, on top of the bsens continuum map at 1.3 mm, show the H41α line emission with levels of, respectively, 1 and 5σ (1σ = 0.01 Jy beam−1). The orange contours define the H II regions, labelled with numbers, and the yellow contours define the surroundings of these bubbles. The dashed pale green and dark green contours are the Ne II line emission, corresponding to contour levels of 1 and 5σ, respectively (1σ = 0.002 erg s−1 cm−2 sr−1).
Current usage metrics show cumulative count of Article Views (full-text article views including HTML views, PDF and ePub downloads, according to the available data) and Abstracts Views on Vision4Press platform.
Data correspond to usage on the plateform after 2015. The current usage metrics is available 48-96 hours after online publication and is updated daily on week days.
Initial download of the metrics may take a while.