Fig. 3
Download original image
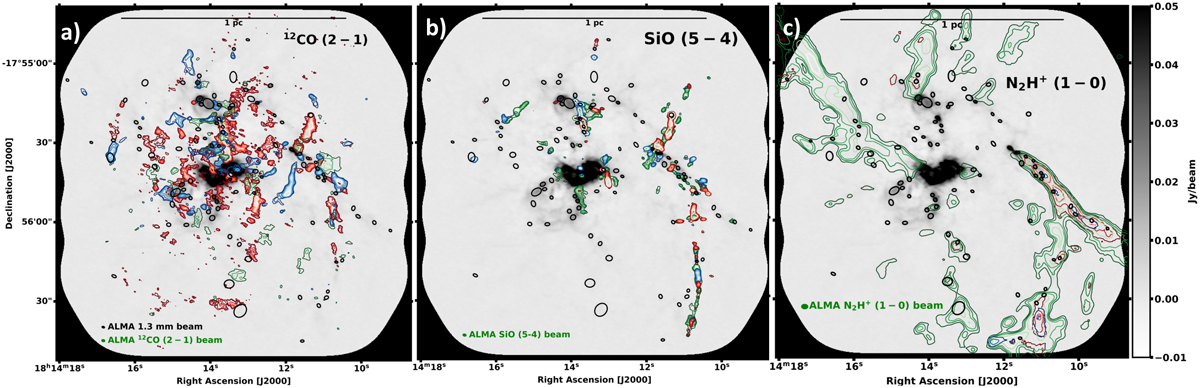
bsens continuum map at 1.3 mm as background image in shades of grey with coloured contours of moment 0 of 12CO (2–1) line emission in panel a, SiO (5–4) line emission in panel b, and N2H+ (1–0) line emission in panel c. For all three panels, the synthesized beams are presented in the lower left corners and a 1 pc scale-bar is shown in the upper part of the maps. Blue, green, and red correspond to integration between respectively, [12; 32] km s−1, [32; 42] km s−1, and [42; 62] km s−1 for all three molecules. (a) With 1σ = 0.7 Jy beam−1 km s−1, the blue and red contour levels are 4, 6, 8, 10, 12, 14 and 16σ. The green ones correspond to 2, 3, 4, and 5 σ. (b) 1σ = 0.03 Jy beam−1 km s−1 and the corresponding contours for all colours are 3, 7, 10, 13, 15, and 17σ. (c) For all colours, the integration levels are 10, 15, 20, 30, and 40σ with 1σ = 0.05 Jy beam−1 km s−1. We show the getsf compact sources in black ellipses.
Current usage metrics show cumulative count of Article Views (full-text article views including HTML views, PDF and ePub downloads, according to the available data) and Abstracts Views on Vision4Press platform.
Data correspond to usage on the plateform after 2015. The current usage metrics is available 48-96 hours after online publication and is updated daily on week days.
Initial download of the metrics may take a while.